Figure 3.
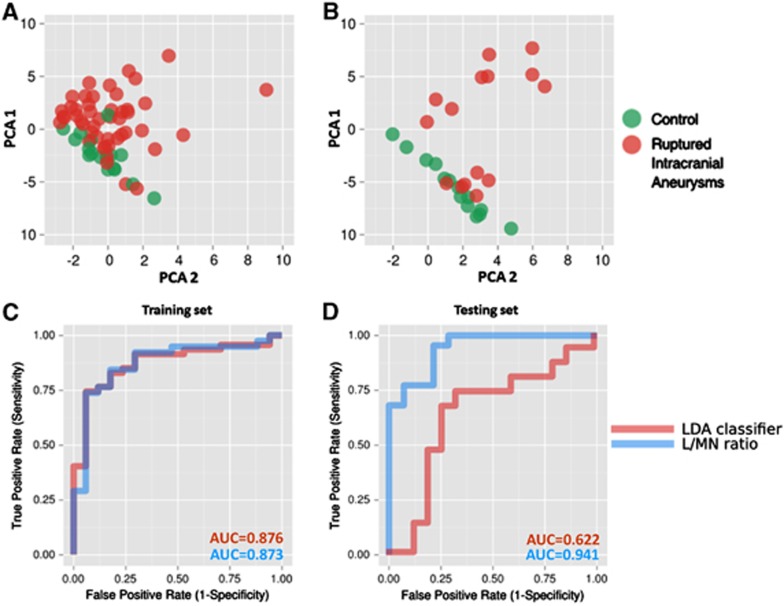
Classification of the samples based on alterations in expression of the selected set of genes. (A) Principal component analysis (PCA) scores plot of qPCR-measured expression levels, showing positions of blood samples from the training set (Set 1) taken from the control (green) and ruptured aneurysm (red) patient groups. (B) PCA scores plot showing positions of the validation set (Set 2) of samples. (C) Receiver operating characteristic (ROC) curve showing the classification performance of the linear discriminant analysis (LDA) classifier based on the first and the second principal components, and lymphocyte-to-monocyte-and-neutrophil (L/MN) gene expression ratio classifier in the training set. (D) ROC curve showing the classification performance of the LDA classifier and L/MN ratio classifier in the validation set.

