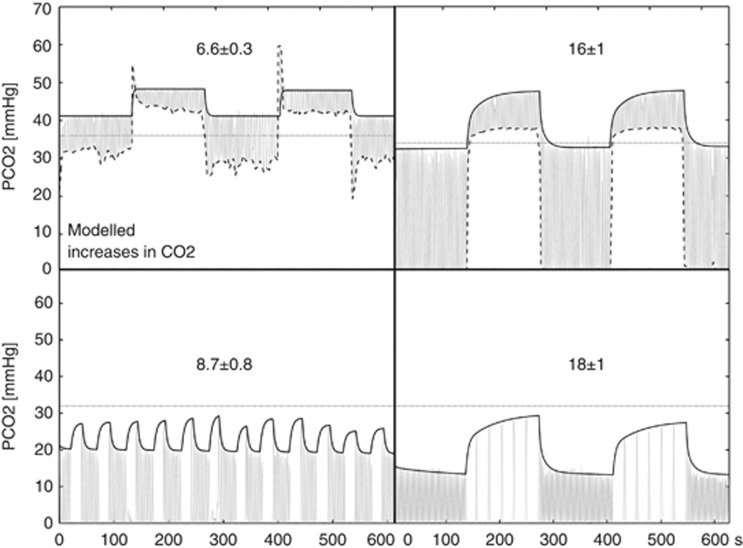
Figure 2.
PETCO2 increases obtained with the modeling of end-tidal CO2 samples. The group mean±SE change is displayed over representative traces of the four different manipulations. Left to right: PC and FI on the top, and BH and HV on the bottom. In each plot, the gray oscillating trace represents the continuous sampling of CO2, and the black trace the model fitted to the PETCO2 points. The horizontal dotted lines correspond to the spontaneously arising resting PETCO2 in this subject. In the gas methods, the dashed traces connect the minimum of tidal PCO2 points, indicating the inspired gas concentration.

