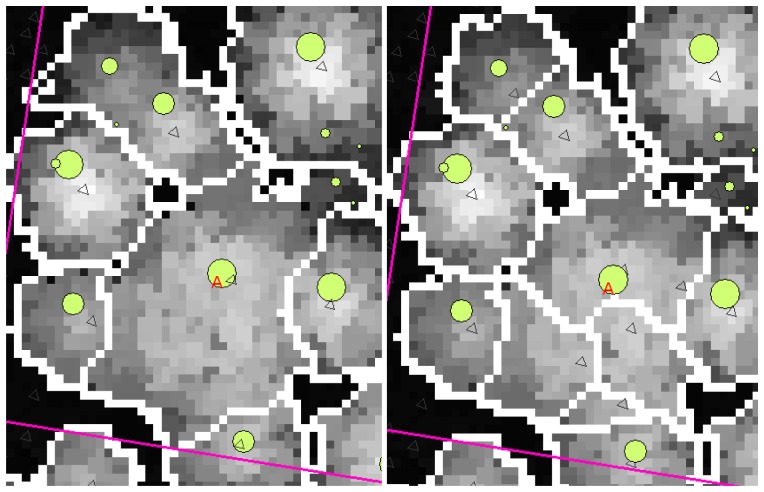
Figure 3.
An example of the effects of smoothing intensity. There is an unsmoothed CHM in the background. Trees measured in the field are marked with circles of a size related to their DBH. The boundaries of the canopies are the result of the segmentation. A large aspen has been marked with an A and local maxima are marked with triangles. The smoothing parameter σ had the value 0.40 in the lowest height class and 2.20 in the highest in the left-hand image, the corresponding σ-values in the right-hand image being 0.40 and 1.20.

