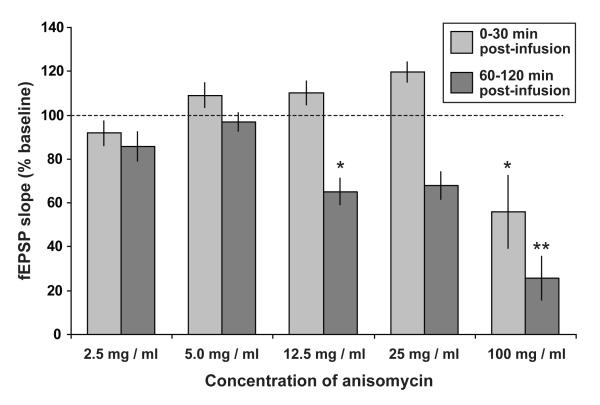
Figure 3. Dose-dependent depression of the fEPSP slope by higher doses of anisomycin.
fEPSP slope 0-30 min and 60-120 min after the end of drug infusion (as a percentage of the value recorded during a 30-min baseline period) is plotted for a range of doses of anisomycin (expressed as μg / μl). All doses were delivered in a total volume of 10 μl (5 μl per ventricle) over 10 min. As the effects of anisomycin were proportionally similar in both ipsilateral and contralateral CA3-CA1 pathways, data from all pathways were combined in this analysis [2.5 μg / μl: n = 6 (3 rats); 5.0 μg / μl: n = 13 (8 rats; data from all control pathways in ‘ANI + strong’ group, Fig. 2); 12.5 μg / μl: n = 4 (1 rat); 25 μg / μl: n = 4 (1 rat); 100 μg / μl: n = 8 (2 rats)]. A main effect of dose was observed both 0-30 min [F(4,30) = 6.15; p < 0.002] and 60-120 min post-infusion [F(4,30) = 19.3; p < 0.001]. Asterisks indicate significant deviations from baseline (100 %; ** p < 0.01; * p < 0.05; one-sample t-tests with Bonferroni correction). All data are plotted as mean ± SEM.

