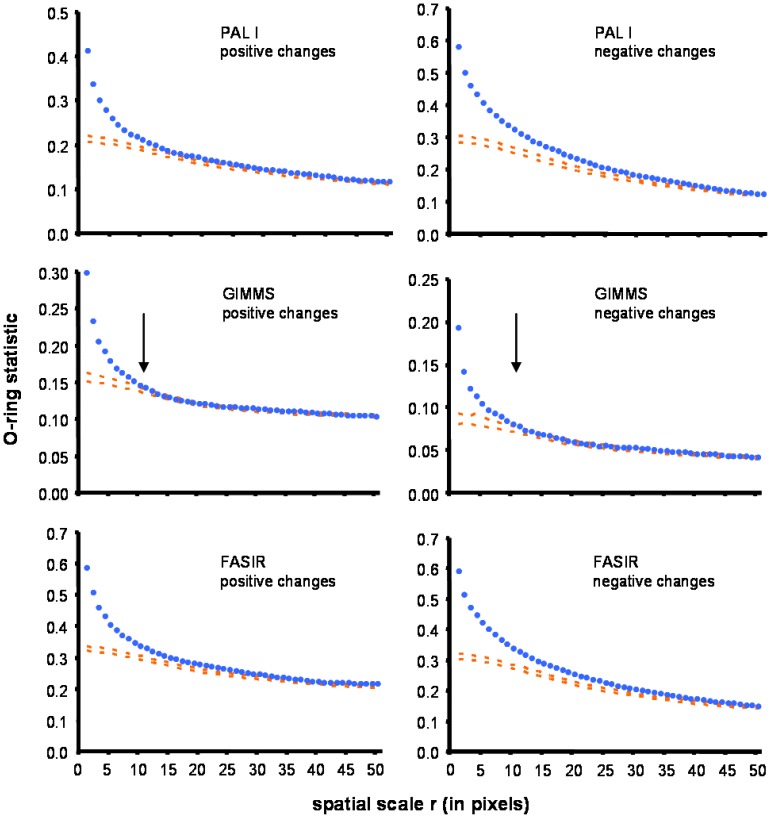
Figure 4.
Spatial association of positive and negative changes showed in FASIR, GIMMS, and PAL series based on the O-ring function. Blue dots indicate the observed pattern and orange dashed lines corresponded to 95% confidence bands for a null random model generated by Monte Carlo simulations. Observed values above the orange indicate aggregation. Arrows indicate the scale at which observed patterns converge with the null model (FASIR and PAL arrows are beyond the shown x scale).

