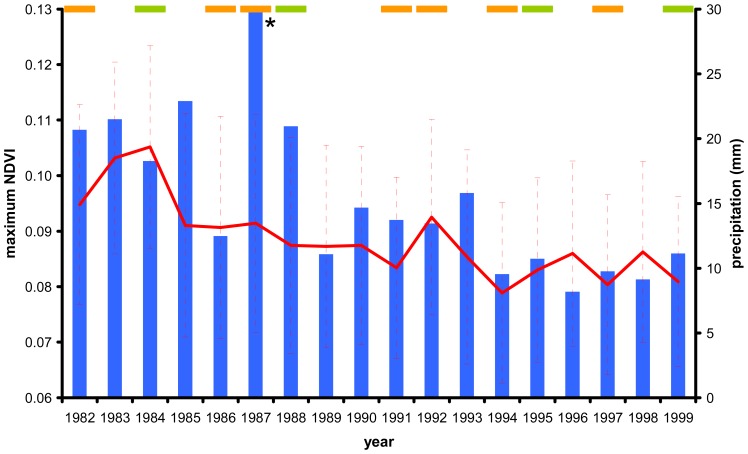
Figure 6.
Northern Chilean deserts FASIR maximum annual NDVI during the 1982-1999 period for 222 significan negative 8×8km pixels (red lines indicates the trend and vertical bars the standard dev tions), annual accumulated precipitation (blue bars) for the approximate region delim ted by the -22.25° to -24.25° latitude and -69.25° to -70.75° longitude from the CR TS 2.1 [118], and El Niño or La Niña years (orange and green upper horizontal bars, respectively), according to the “Multivariate ENSO Index” (MEI) [119] and “El iño & La Niña Years: A Consensus List” (http://ggweather.com/enso/yers.htm). The correlation coefficient (r2) between MEI and NDVI annual maximum values was 0.03 (α=0.05). * for the year 1987 the precipitation was 86 mm.

