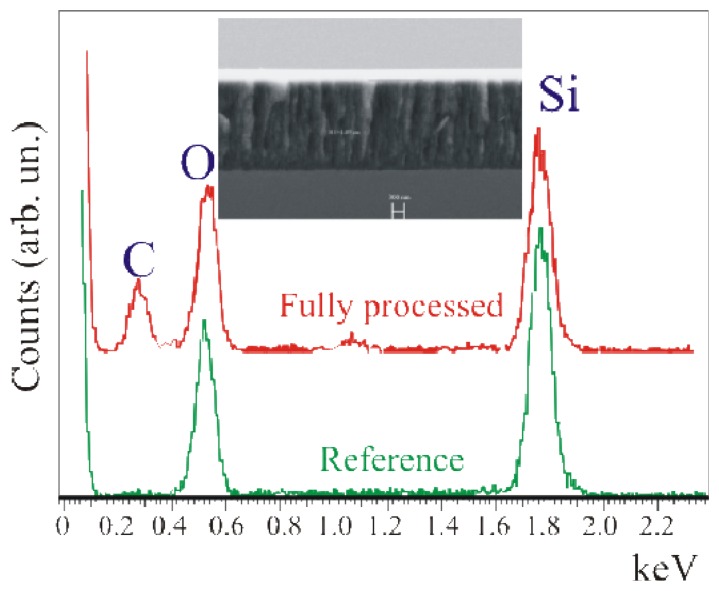
Figure 6.
EDX measurements coupled to SEM on the cross section for the reference (green line) and the fully processed (Full+SSC, red line) samples. Both measurements were acquired close to the porous SiO2/Si interface. In the insert the SEM image of a porous SiO2 sample cross section. The marker is 300 nm.

