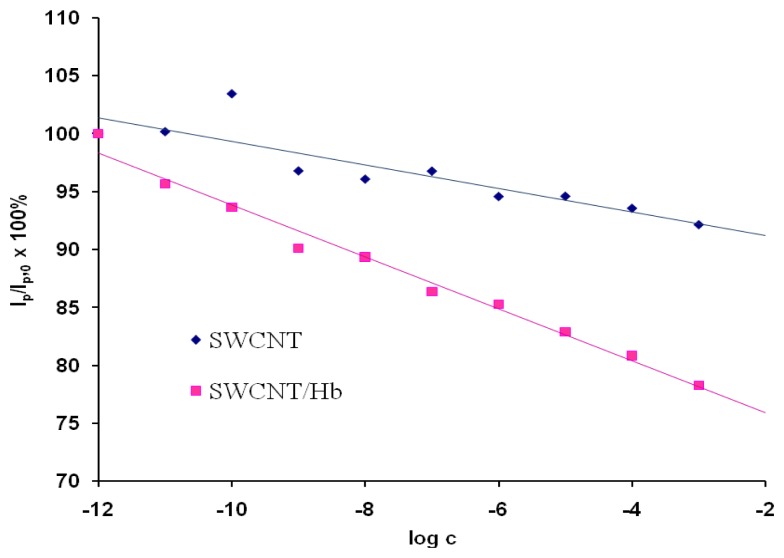
Figure 3.
The ratio of OSWV peak current in the presence of different concentration of acrylamide (Ip) to that in the absence of acrylamide (Ip,0) as a function of the acrylamide concentration. The currents were measured at the peak potential in OSWV curves in the solution with no analyte Ep,0. Results obtained for electrodes modified with SWCNT, Ep,0=46 mV, n=4, 2.2<SD<7.7 (
 ) and SWCNT/Hb, Ep,0=44 mV, n=3, 0.9<SD<4.4 (
 ).
).

