
FIG. 3.
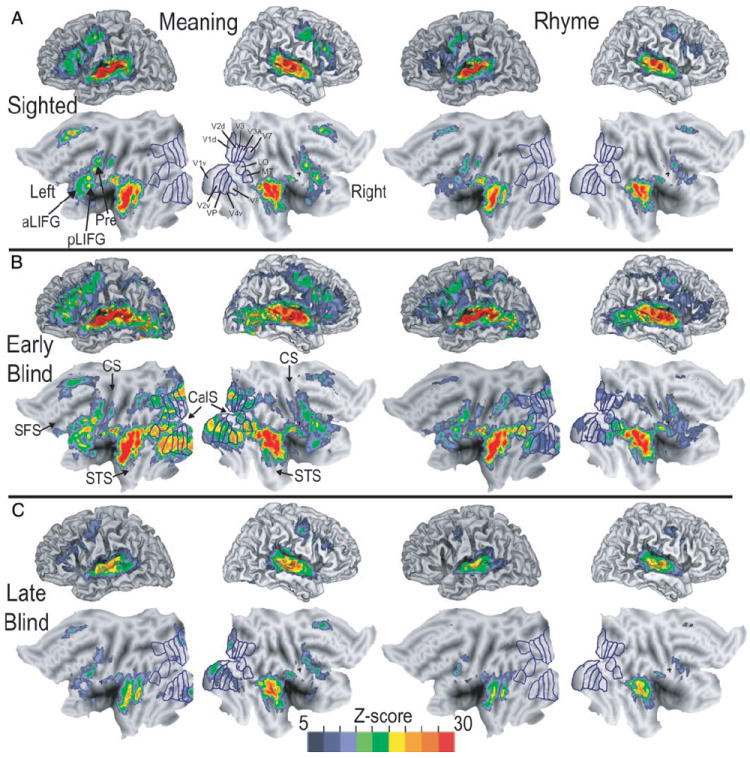
Three-dimensional and matching flattened views for left and right hemispheres of average z-score statistical parameter maps showing location of significant BOLD responses in sighted, early blind, and late blind participants. Left two columns: images show results when participants attempted to identify common meaning between groups of 16 words. Right two columns: images show results when participants noted common rhyme that linked groups of 16 words. Visuotopic borders drawn and labeled according to prior results obtained in sighted participants (Hadjikhani et al. 1998; Van Essen 2002a,b). A: average z-score maps from 8 sighted participants. B: average z-score maps from 9 early blind participants. C: average z-score maps from 7 late blind participants. aLIFG, anterior left inferior frontal gyrus; CalS, calcarine sulcus; CS, central sulcus; Pre, precentral gyrus; LO, lateral occipital area; MT, medial temporal area; pLIFG, posterior left inferior frontal gyrus; SFS, superior frontal sulcus; STS, superior temporal sulcus; V1d, V1v, dorsal and ventral primary visual areas, respectively; V2d, V2v, dorsal and ventral second visual areas, respectively; V3, V3A, third visual areas; V4v, ventral fourth visual area; VP, ventral posterior visual area; V7, seventh visual area; V8, eighth visual area.