
FIG. 7.
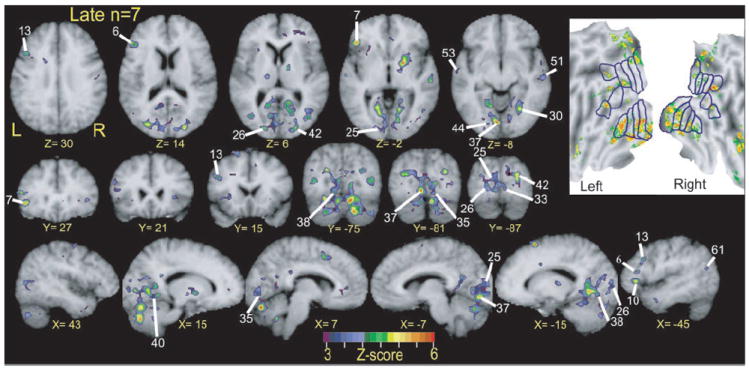
Selective sections show regions with significant response variance between two language tasks over course of trials. These z-score statistical parameter maps reflect F-ratios per voxel for language condition by time interaction term in ANOVA analysis for BOLD responses in 7 late blind participants. Numbered labels cross-reference to regions listed in Table 3. All regions were objectively defined as noted in METHODS. Inset: results from same analysis in flattened view of visual cortex. See additional details in text of Figs. 3 and 5.