
FIG. 8.
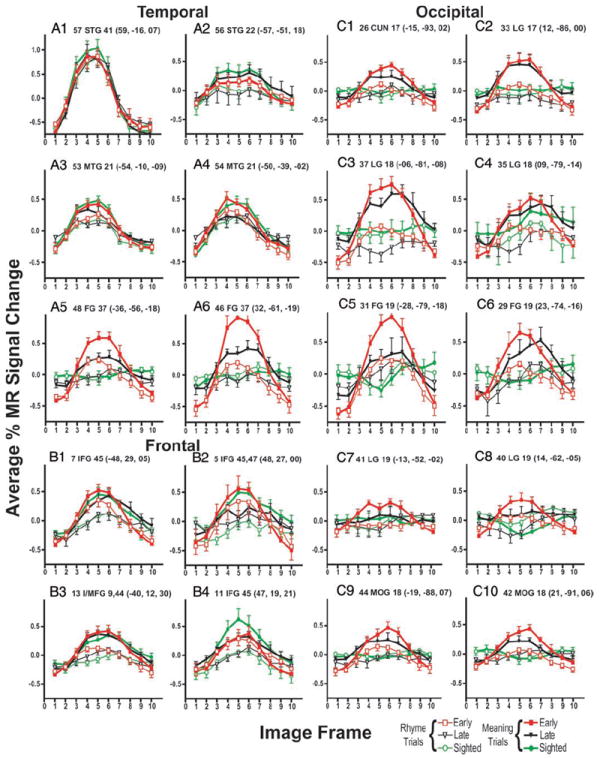
Time course of BOLD responses per voxel in selected regions for each group of participants and by language task: MEANING and RHYME trials. Each data point shows mean and SE for selected group and language condition. Average percentage change in MR signal was obtained by analyses of signal magnitudes per frame throughout a region volume (see METHODS). Frames numbered along abscissa represent sequential TR intervals of 2.844 s. Title for each graph lists, in order: region number from Table 3 and Figs. 5, 6, and 7; anatomical location (abbreviations defined in Table 3); Brodmann area number; and X, Y, Z atlas coordinates for peak z-score for defined region. A1–A6: results from regions located in temporal lobe. B1–B4: results from regions located in frontal lobe. C1–C10: results from regions located in occipital lobe. Regions located in left hemisphere shown on left in each panel.