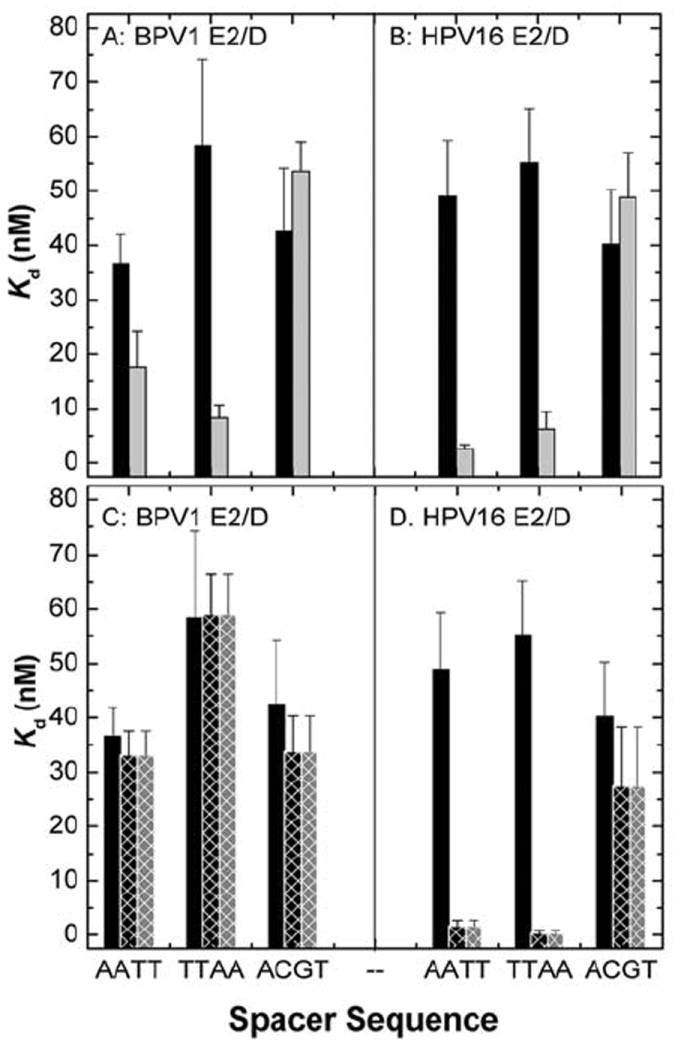
Figure 9.

Summary of the equilibrium binding constants (Kd, nM) determined for in BPV1-E2/D (A & C) HPV16-E2/D and (B & D) binding to DNA containing the AATT, TTAA and ACGT spacer sequences. Panels A and B summarize binding in buffer containing 150 (black bars) and 250 mM (grey bars). The ionic strength of these solutions is 0.15 and 0.25, respectively. Panels C and D summarize binding in the presence of Mg2+: buffer containing 150 mM KCl (black bars), buffer containing 150 mM KCl and 10 mM MgCl2 (black crosshatched bars; ionic strength = 0.19 M), buffer containing 110 mM KCl and 10 mM MgCl2 (grey crosshatched bars; ionic strength = 0.15 M) (27). The data indicated the increased affinity with AT rich sequences as KCL concentration increase, and in the presence of MgCl2. Figure reprinted from reference (27) with permission from Elsevier.
