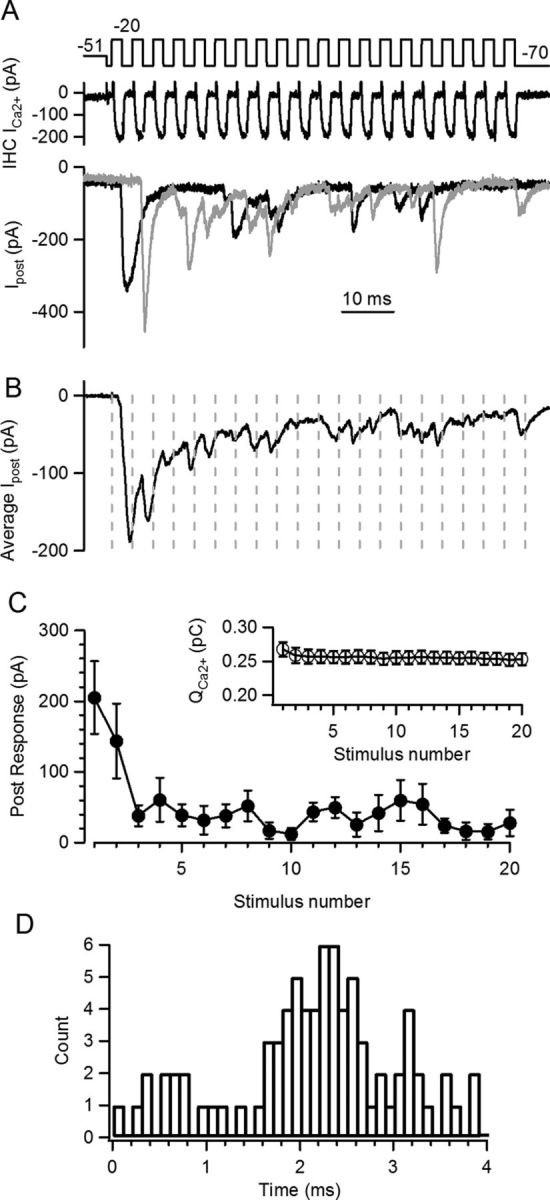
Figure 1.

Periodic stimulation at the IHC ribbon synapse. A, Train of pulses to −20 mV (Vh = −70 mV, 2 ms + 2 ms, i.e., 250 Hz) following a predepolarization to −51 mV. Top panel: stimulation protocol, middle panel: IHC Ca2+ currents, bottom panels: two repetitions of the postsynaptic response. B, Average trace of n = 8 postsynaptic responses. Dashed lines indicate cycles' limit, where local peaks of the postsynaptic response can be observed. C, Average amplitude of postsynaptic responses at each pulse in the train. Note fast synaptic depression. Inset, Ca2+ charge produced by each pulse in the train at the IHC. Slight inactivation was observed during the train. D, Phase (or latency) plot for all EPSCs occurring during the train, regardless of their amplitudes or shapes. The histogram was constructed with latencies of all EPSC activated in each cycle, relative to the beginning of that cycle.
