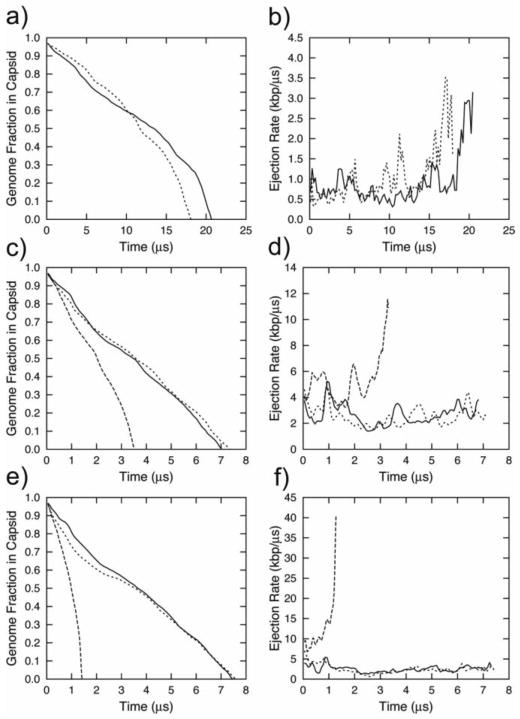
Figure 7.
Ejection data for viral DNA released from bacteriophage φ29 demonstrating the qualitative effects of variable viscosity inside the capsid. a) Fraction of DNA inside the capsid as a function of time, with variable viscosity inside the capsid (γmax=10−1 ps−1 and γmin=10−4 ps−1, with no applied pulling force; dotted and solid lines represent semilogarithmic and radical dependencies of the viscosity inside the capsid on the DNA fraction ejected, respectively.); b) Ejection rates corresponding to the trajectories described in panel a; c) fraction of DNA inside the capsid as a function of time with the viscosity inside the capsid varying according to the semilogarithmic law (γmax=10−2 ps−1 and γmin=10−4 ps−1), with a pulling force of 4 atm; d) Ejection rates corresponding to the trajectories described in panel c. e) Fraction of DNA inside the capsid as a function of time with the viscosity variable inside the capside according to the semilogarithmic law (γmax=10−3 ps−1 and γmin=10−4 ps−1) and with a pulling force of 16 atm; f) ejection rates corresponding to the trajectories described in panel e) In panels c–f, the dashed lines represent the case where the force was applied to one pseudoatom inside the connector (“tube” style); the solid lines depict the protocol where the full magnitude of force was applied to the first ejected pseudo-atom (“last atom” style); and the dotted lines correspond to the force equally distributed over all ejected pseudo-atoms (“ejected” style).

