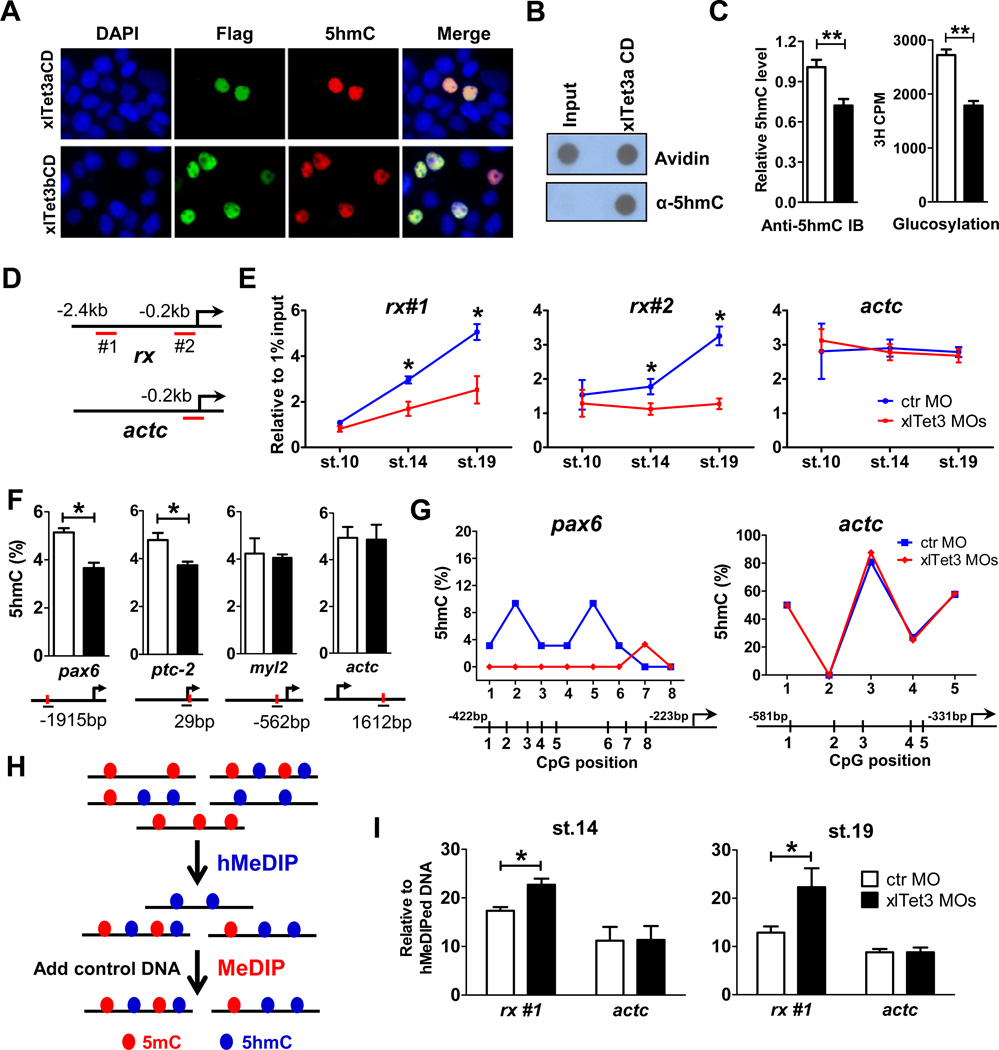
Figure 3. Tet3 is an active 5mC hydroxylase regulating the 5mC/5hmC status at target gene promoters.
(A) xlTet3 CD is sufficient to convert 5mC to 5hmC in HEK293T cells by immunofluorescence analysis. Flag-tagged xlTet3 CD protein was detected using Flag antibody.
(B) xlTet3a CD protein converts 5mC to 5hmC in vitro by dot-blot assay. Avidin-HRP is used to detect total biotin-labeled DNA, showing equal loading.
(C) Tet3 depletion results in globally decreased 5hmC in stage 14 embryos by dot-blot (left) and 5hmC glucosylation (right) assays. Open bar: control MO, filled bar: xlTet3 MOs. Data are presented as mean ± SD (n=3). **P<0.01.
(D–E) hMeDIP-qPCR to detect dynamic 5hmC level changes in stage 10, 14 and 19 embryos. The targeting region for each primer set is underlined in panel D. Results are shown as mean ± SD (n=3) in panel E. *P<0.05.
(F) Site-specific 5hmC level changes by Tet3 depletion in stage 14 embryos using the EpiMark 5mC/5hmC analysis kit. Open bar: control MO, filled bar: xlTet3 MOs. Red dot indicates MspI/HapII recognition site and each PCR amplified region is underlined. Arrow denotes promoter orientation. Data are shown as mean ± SD (n=3). *P<0.05.
(G) TAB-seq analyses of 5hmC status at the promoter of pax6 (left) and actc (right) in stage 14 embryos. The average percent at each CpG site is derived from sequencing of 30–32 clones for pax6 promoter and 24–26 clones for actc promoter.
(H) Schematic diagram of hMeDIP-MeDIP strategy.
(I) hMeDIP-MeDIP qPCR to detect 5mC level changes after Tet3 depletion in stage 14 and 19 embryos. Data are shown as mean ± SD (n=3). *P<0.05. The targeting region for each primer set is shown in panel D.
See also Figure S3.

