
Figure 10.
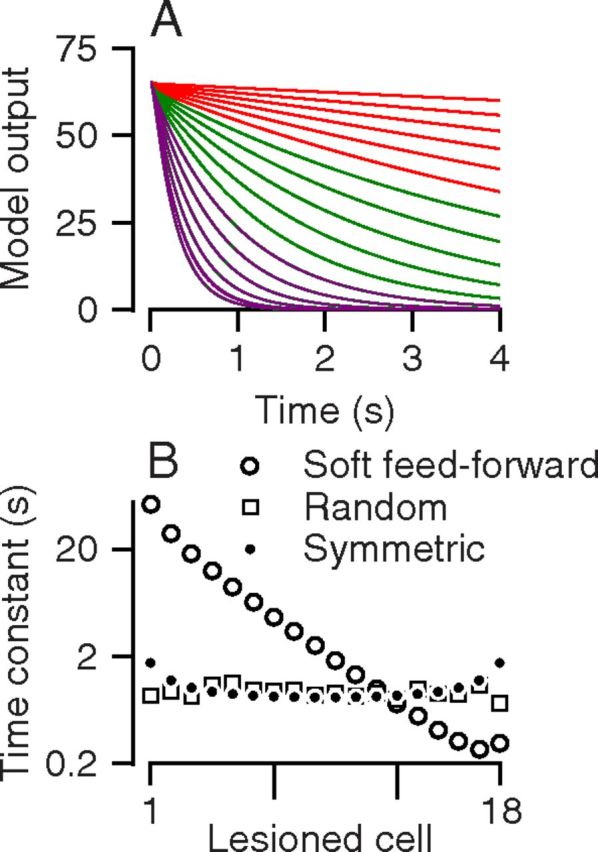
The effect of lesions on the model output. A, Each trace shows the output of a hierarchical network when the weights of one of the cells are decreased to 95% from perfect integrations. Colors denote the group of the cell with the reduced weight: red indicates model unit numbers 1–6, green indicates model unit numbers 7–12, purple indicates model unit numbers 13–18. B, The time constant of the decay in activity as a function of the number within the hierarchical network of the cell that was lesioned. Open circles, open squares, and filled circles show results for the networks with stronger feedforward connections, uniformly random connections, and symmetric connections.