
Figure 11.
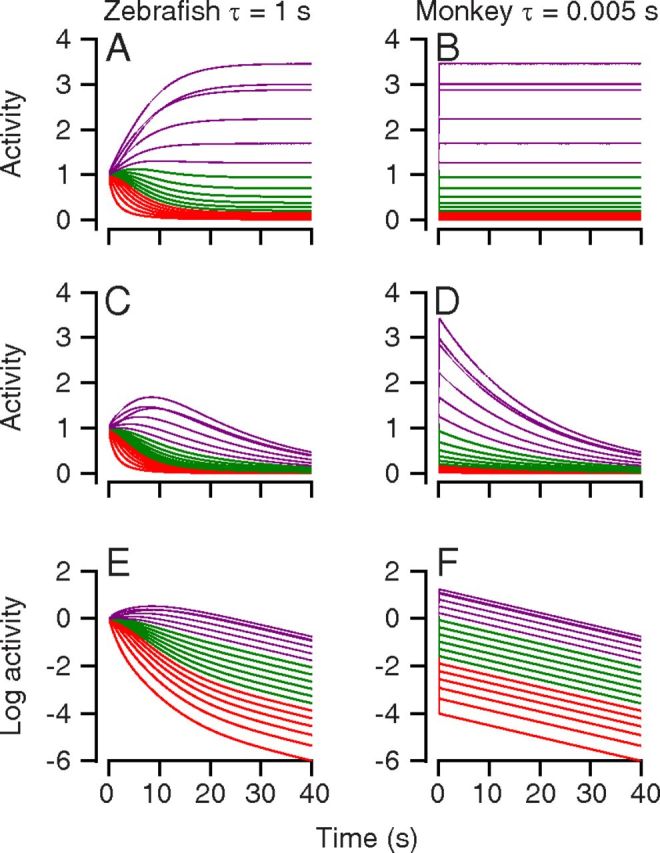
Comparison of the responses of different model neurons in networks that used short and long time constants in the model neurons. Each trace shows the time-varying firing rate of an individual neuron and different colors denote different groups of neurons: red indicates model unit numbers 1–6, green indicates model unit numbers 7–12, purple indicates model unit numbers 13–18. The left and right column show results from simulations with neural time constants of 1 and 0.005 s. A, B, Networks are tuned to produce perfect integration. C, D, Networks are tuned to have a decay time constant of 20 s in their overall output. E, F, Same as C, D, but the responses of the model neurons are plotted on a log scale.