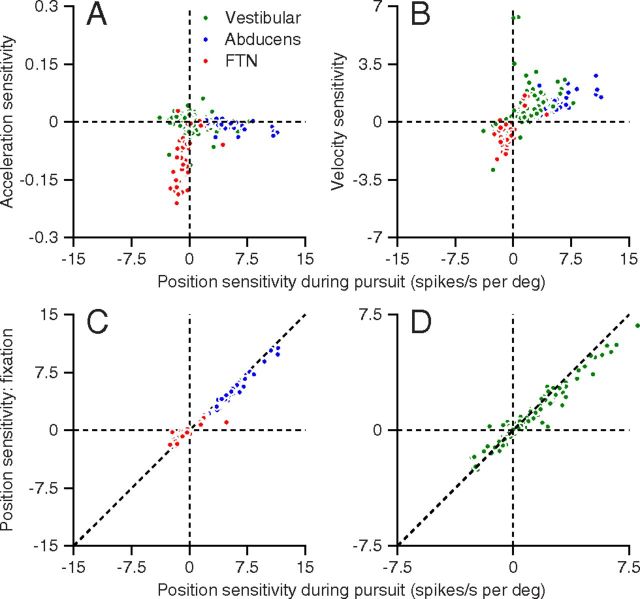
Figure 2.
Sensitivity of different groups of neurons to the parameters of eye movement. Each symbol shows the response of an individual neuron; red, green, and blue dots represent FTNs, vestibular neurons, and abducens neurons A, Eye acceleration versus position sensitivity. B, Eye velocity versus position sensitivity. All values of sensitivity from Equation 6. C, D, The slope of the regression line relating firing rate to steady eye position during fixation versus position sensitivity during smooth pursuit trials, from Equation 6. Dashed diagonal line illustrates the unity line. Positive values of sensitivity correspond to increases in firing rate for eye movements toward the side of the recording.

