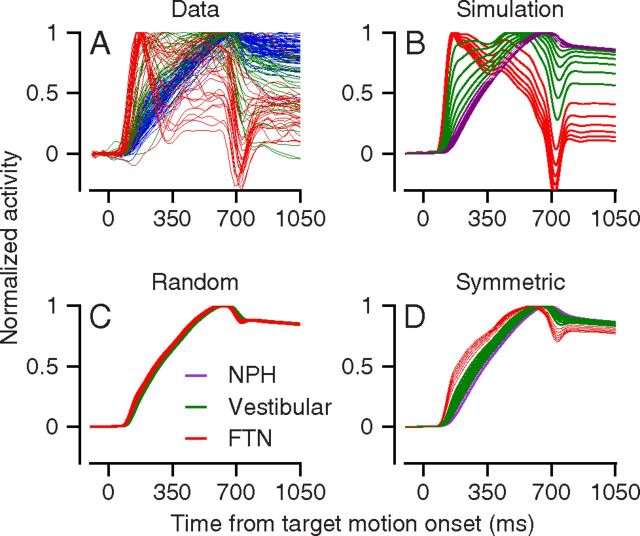
Figure 8.
Responses of model neurons for different connection matrices. Each trace shows the time-varying firing rate of an individual neuron and different colors denote different groups of neurons. A, Data. B, Model with strong feedforward and weak feedback connections. C, Model with connection strengths drawn randomly from a positive uniform distribution. D, Model with equal strengths of feedforward and feedback connections.

