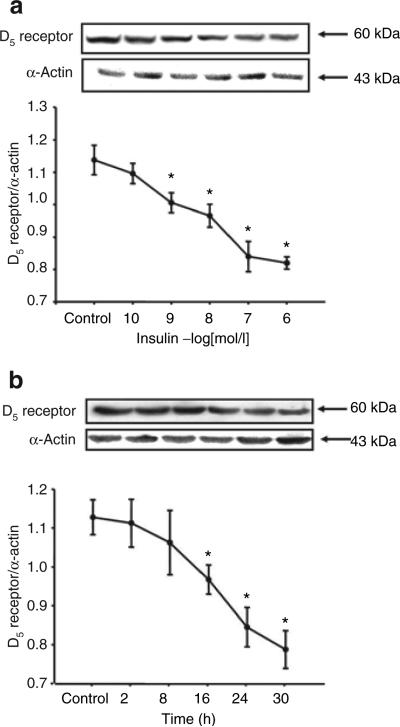
Figure 3.
Effect of insulin on D5 receptor expression in RPT cells from SHRs. (a) Concentration-dependent response of D5 receptor protein expression in RPT cells from SHRs treated with varying concentrations of insulin for 24 h. Results are expressed as the ratio of D5 receptor and α-actin densities (n = 6, *P < 0.05 vs. control, ANOVA, Duncan's test). (b) Time-dependent response of D5 receptor protein expression in RPT cells from SHRs treated with insulin (10−7 mol/l). Results are expressed as the ratio of D5 receptor and α-actin densities (n = 4, *P < 0.05 vs. control, ANOVA, Duncan's test). ANOVA, analysis of variance; RPT, renal proximal tubule; SHRs, spontaneously hypertensive rats.

