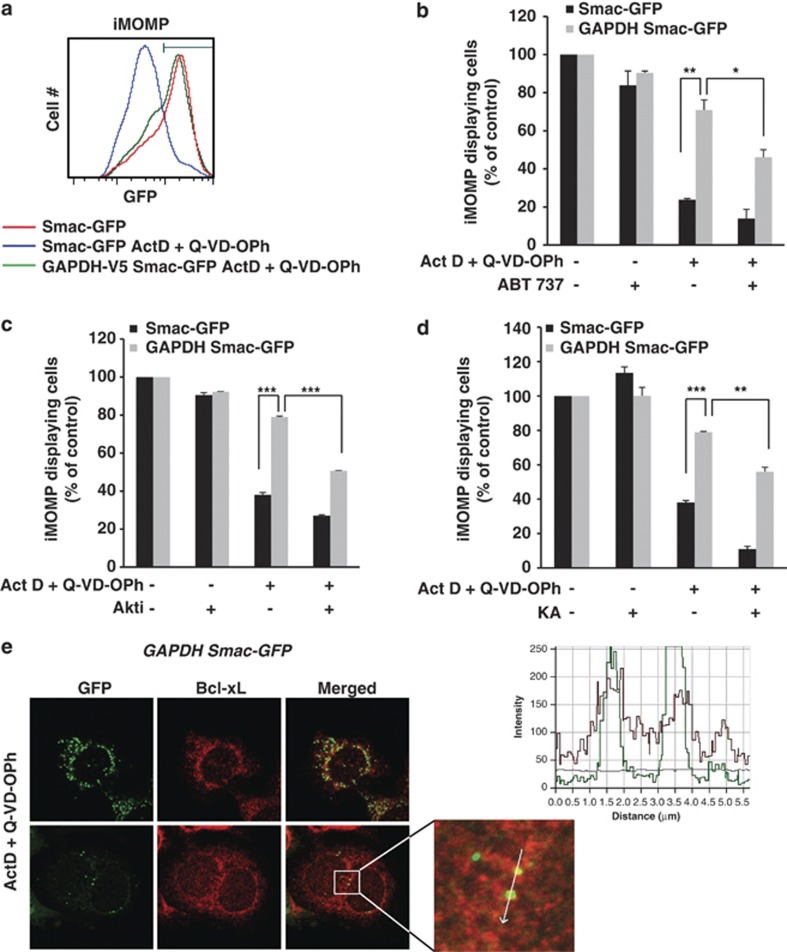
Figure 8.
GAPDH leads to iMOMP through Akt activation and Bcl-xL overexpression. (a) HeLa cells expressing Smac-GFP with or without GAPDH-V5 (as indicated) were treated for 6 h with Act-D (0.5 μM)+Q-VD-OPh (20 μM) and analyzed by flow cytometry for GFP fluorescence intensity 72 h later. The gate denotes the population with the highest number of Smac-GFP-fluorescent cells. (b–d) The indicated HeLa cells were treated for 6 h with Act-D (0.5 μM)+Q-VD-OPh (20 μM) in the presence of 10 μM ABT-737 (b), 1 μM Akti (c) or 0.5 μg/ml KA (d). After 72 h, the cells were analyzed by flow cytometry for GFP fluorescence intensity. iMOMP-displaying cells are represented as the population with the highest Smac-GFP fluorescence (as % of control untreated cells). (e) A representative confocal microscopy image from single-cell cultures showing intact cells (top) and iMOMP (bottom) in HeLa cells expressing GAPDH and Smac-GFP. The cells were treated with 0.5 μM Act-D and the caspase inhibitor Q-VD-OPh (20 μM) for 6 h. The caspase inhibitor was added 30 min before the apoptotic agent. After 24 h, MOMP and Bcl-xL expression was analyzed by confocal microscopy. The line scan (right) indicates colocalization of Smac-GFP and Bcl-xL, and correlates with the line drawn in the image. The data are the means of three independent experiments. ***P<0.005, **P<0.01, *P<0.05. The confocal images are representative of five independent experiments

