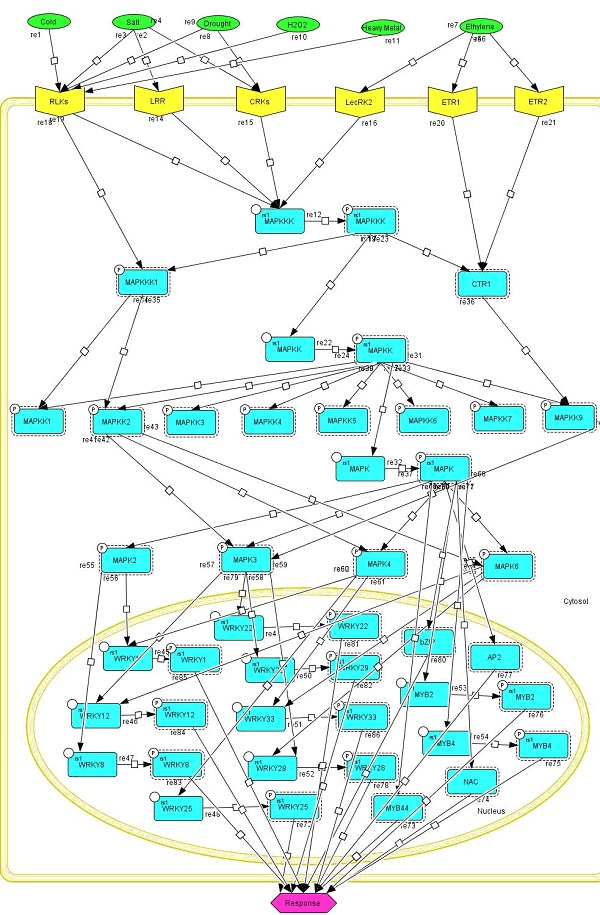
Figure 1.

MAPK abiotic activation model was created using CellDesigner ver.4.1. The graphical representation is compliant with system biology graphical notation (SBGN), Process diagrams, explicitly displaying simple molecules like abiotic stresses (Cold, Salt, Drought, H2O2, Heavy metal, Ethylene), receptors, proteins (different members of MAPKs with transcription factors) some of phosphorylated forms. The active state of the molecules is indicated by a dashed line surrounding the molecule and response in the form of phenotype symbol by using different form of colors and shape for some species, the frame in yellow represents the cellular membrane.
