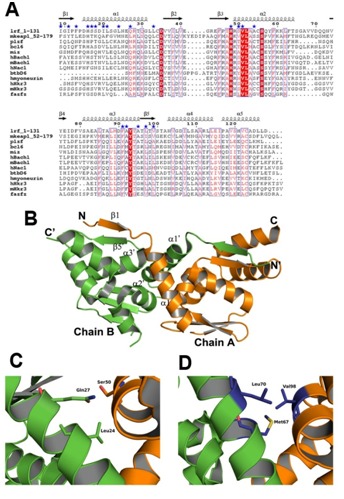
Figure 2.

Comparison analysis of the intact BTB-dimer. (A) Sequence alignment of mKeap1 (aa: 52-179; KEAP1_MOUSE) with sequences of selected known crystal structures. The dimer interface residues are marked by blue stars. The secondary structural features from hLrf (PDB Id: 2NN2) are shown above the alignments. The first eight amino acids in hLrf are not included as this region is absent in the crystal structure. The colors reflect the similarity (red boxes and white characters for conserved residues; red characters for similarity in a group; blue frames for similarity across groups). The sequence was aligned and rendered by Clustal W [21] and ESPript [23], respectively. (B) The dimer arrangement of hLrf-BTB (PDB Id: 2NN2). The dimer interface region is only labeled for clarity. (C) A representative figure showing hydrophilic intermolecular interactions in the hLrf-BTB domain. (D) The corresponding region in mKeap1 showing hydrophobic environment due to Met67, Leu70 and Val98.
