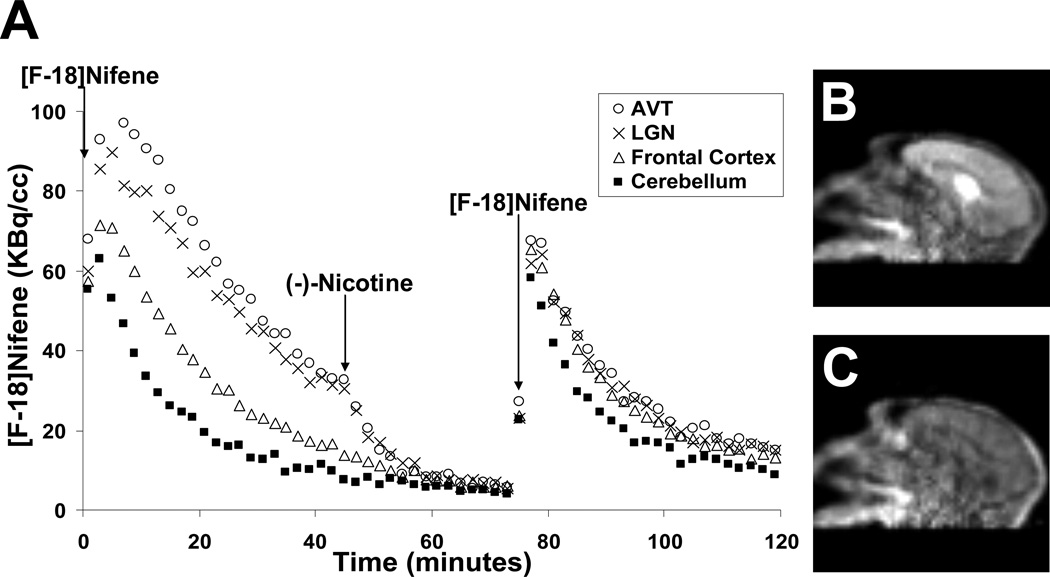
Fig. 5.
(A) Time-activity curves (uncorrected for radioactive decay) of [F-18]nifene in the AVT and LGN regions, frontal cortex, and cerebellum over the course of a single 120 minute scan (M3) with injections of (−)nicotine at 45 minutes and 79 MBq [F-18]nifene at 75 minutes (denoted by arrows). (B) and (C) on the right show summed frames from 20–30 minutes and 60–70 minutes, respectively.

