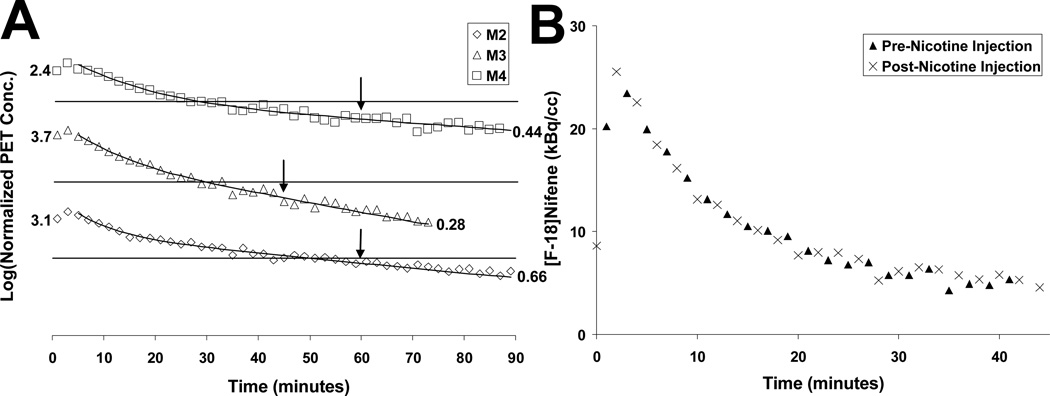
Figure 6.
Cerebellum Time Activity Curves. (A) The cerebellar time course for the three displacement studies. Discrete data points denote observed data. Solid curves were the result of fitting a bi-exponential function to the data up until time of (−)nicotine challenge; the line after the arrow illustrates values extrapolated from the time course of the pre-nicotine data. The arrows denote the time of (−)nicotine injection. Scale on the y-axis is indicated by the numbers representing the first and last data point. Lines represent normalized PET concentrations of 1. (B) PET concentrations from the same experiment (M4) in the cerebellum from the initial pre-nicotine injection(▲) and cerebellum concentrations from the post-nicotine blockade injection(×). Values are normalized to injected activity.

