
Figure 4.
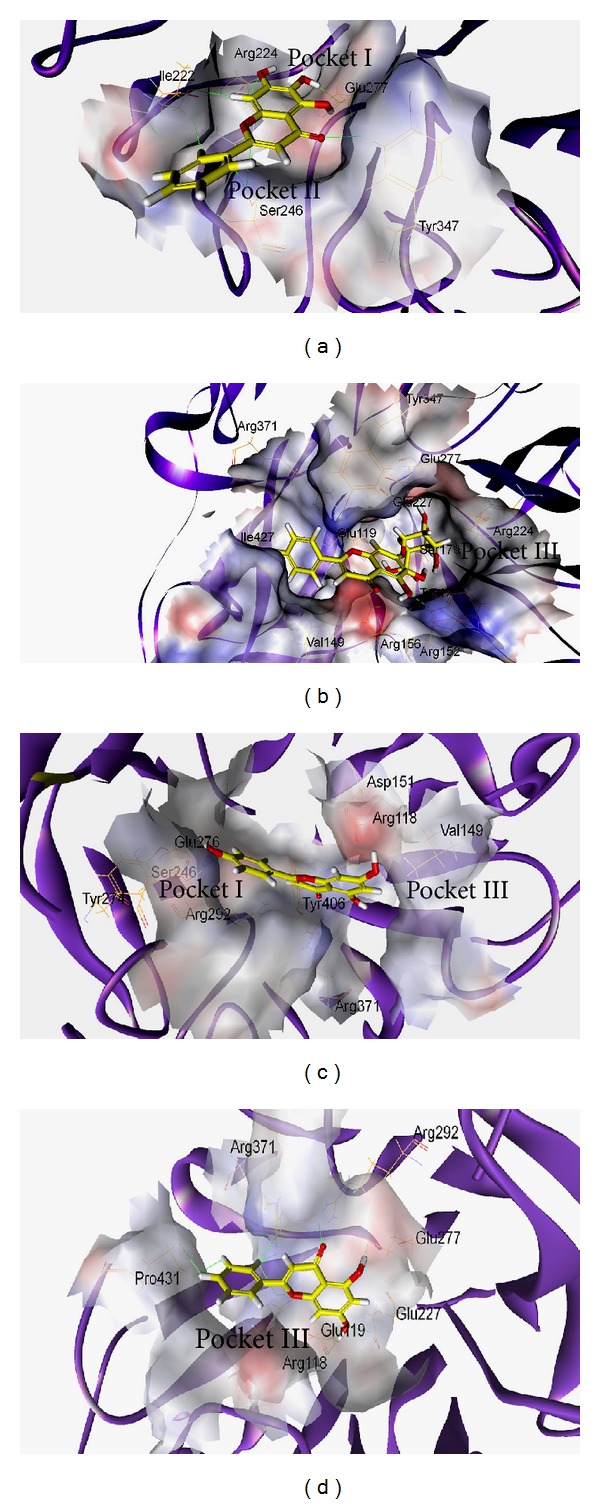
Molecular modeling. Baicalein (a), baicalin (b), apigenin (c), and chrysin (d) docked well with NA1 active sites. The binding amino acids are shown as lines and labels. The carved surface representation of the pocket formed from flavonoid binding is shown as transparent gray.