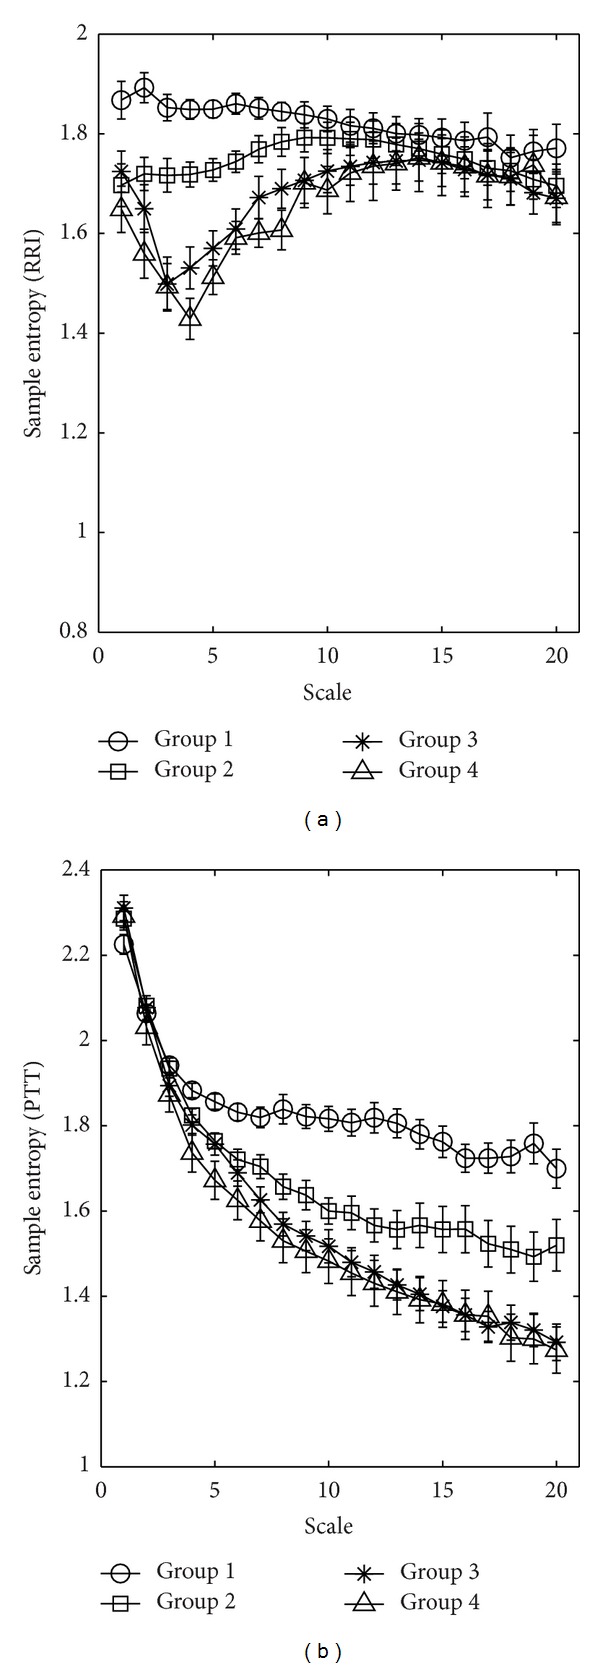
Figure 2.

Multiscale entropy (MSE) analysis of (a) RRI and (b) PTT time series showing changes in sample entropy, S E, among the four groups of study subjects for different scale factors. Symbols represent the mean values of entropy for each group, and bars represent the standard error (given by , where n is the number of subjects).
