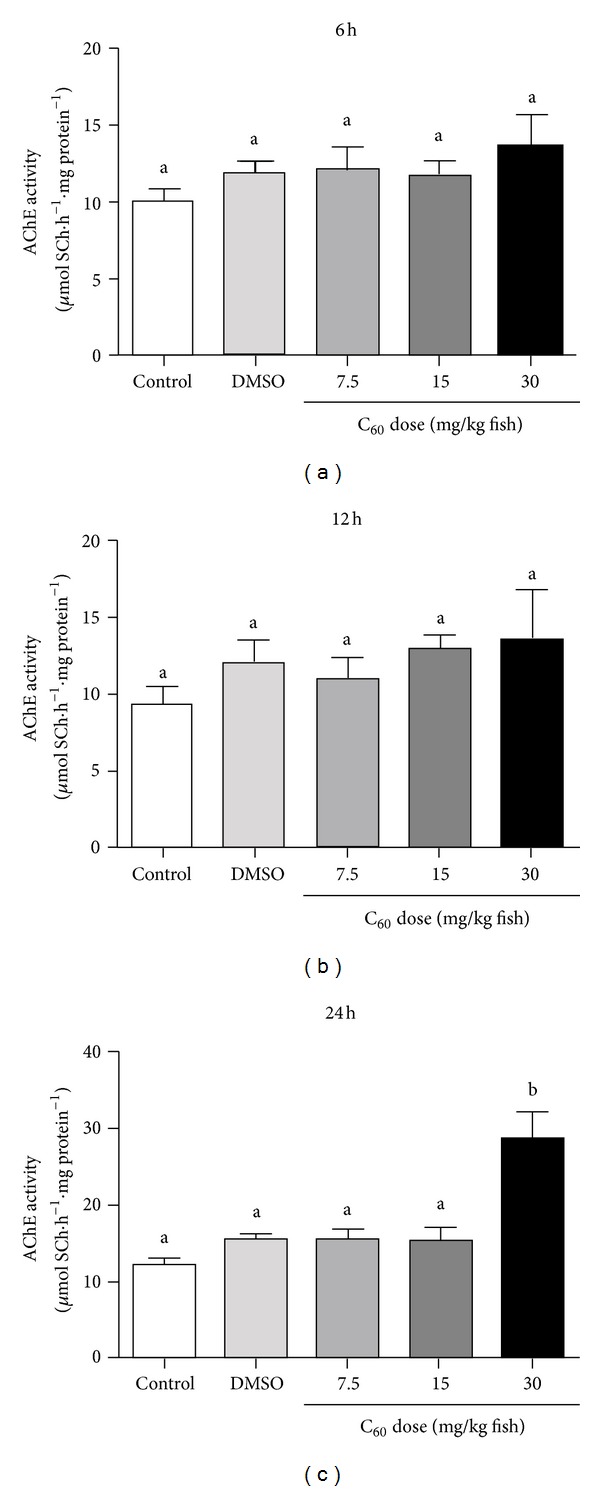
Figure 2.

In vivo AChE activity in zebrafish brain after 06 (a), 12 (b), and 24 hours (c) of fullerene C60 exposure at distinct concentrations (7.5–30 mg/kg fish). Bars represent the mean ± SEM of at least three different experiments, each one performed in triplicate. The specific enzyme activity is reported as micromoles of thiocholine released per hour per milligram of protein. Bars represent the mean ± SEM of at least three independent experiments, each one performed in triplicate. Different letters indicate significant differences (P < 0.05) between groups.
