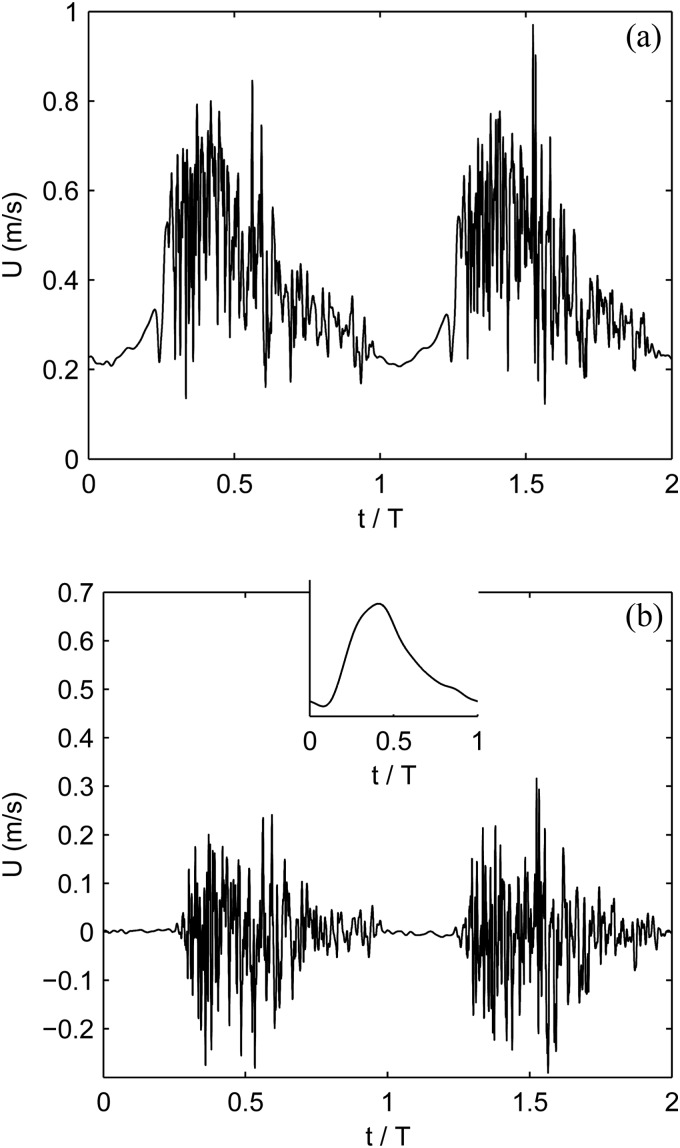
Fig. 2.
Streamwise blood velocity versus time for two cardiac cycles. The time history is taken from a point in the venous outflow of patient 1 about 5 mm downstream of the anastomosis in the center of the vessel. (a) The raw time-signal. (b) The time signal with the 5 cycle phase-averaged velocity removed. The inset shows the phase of the arterial inflow.

