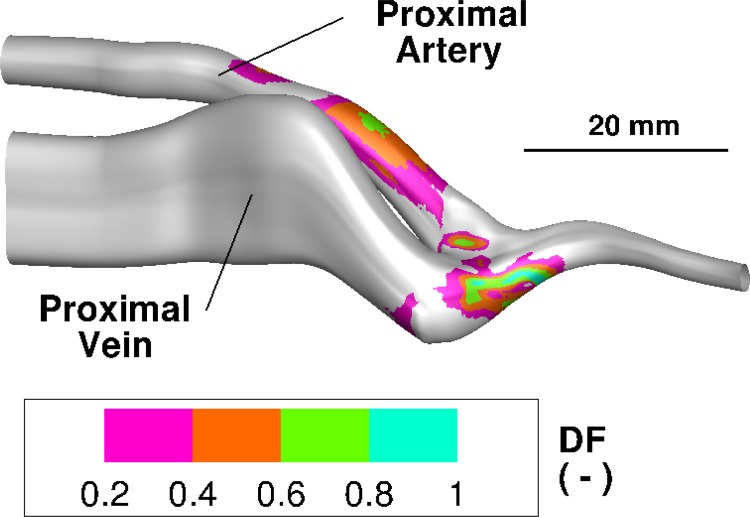
Fig. 4.
Shear stress duty factor distribution on the lumen for patient no. 1 using a threshold shear of 15 Pa. The bar labeled 20 mm shows the relative size. The large values of the duty factor in the proximal artery are due to the vessel curvature which produces a strong secondary helical flow. The large value of the duty factor on the anastomosis is due to the impingement and stagnation point flow.

