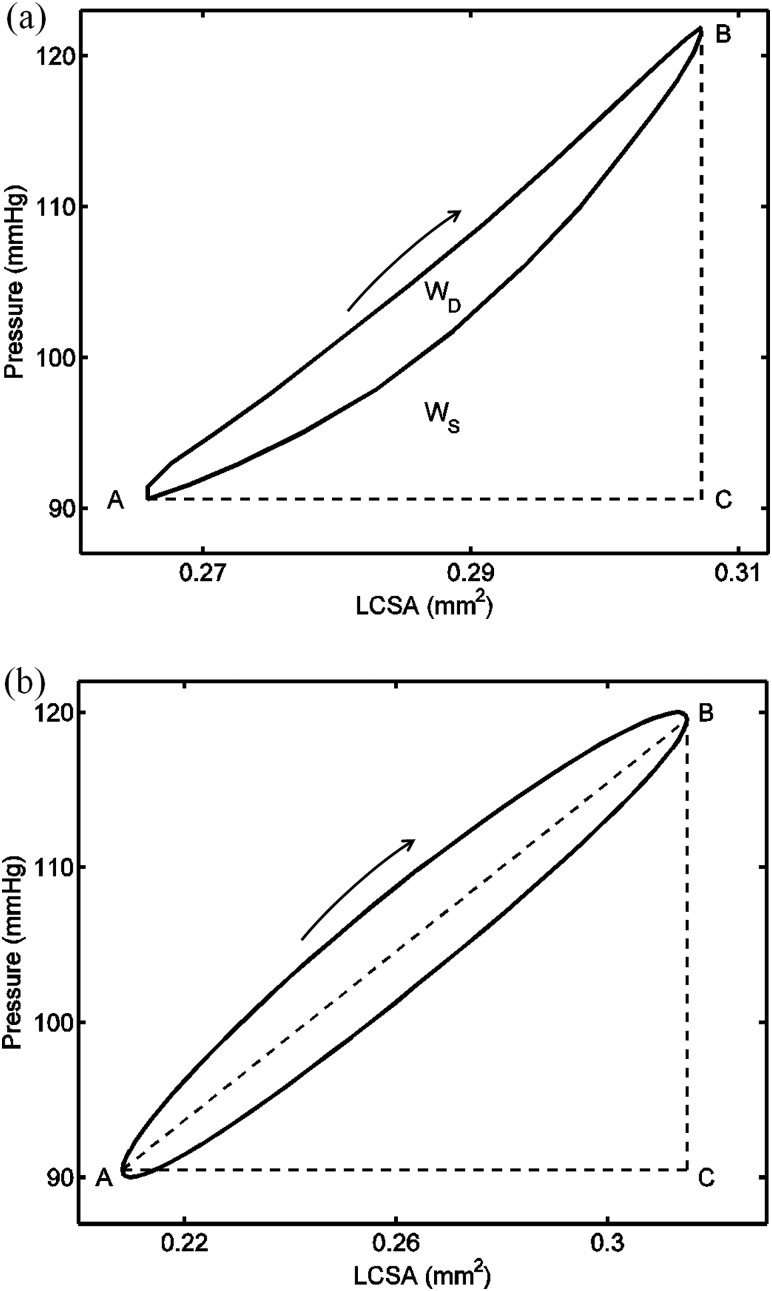
Fig. 1.
Illustration of the estimation of the damping capacity (a) with the nonlinear method on a clockwise pressure-luminal cross-sectional area (P-LCSA) loop obtained from a carotid artery at 10 Hz, and (b) with the linear method on an elliptical P-LCSA loop. Points A and B are the points corresponding to the maximum and minimum LCSA in the hysteresis loop, respectively. Point C is the point with the maximum LCSA value and the pressure value at point A. Here, WD is the loop area and WS is the area under the loading (upper) curve and above the straight line AC. Loading curves are indicated by the arrow. Note that the hysteresis loop in (a) shows a weak nonlinearity in that the loop deviates slightly from an elliptical shape.

