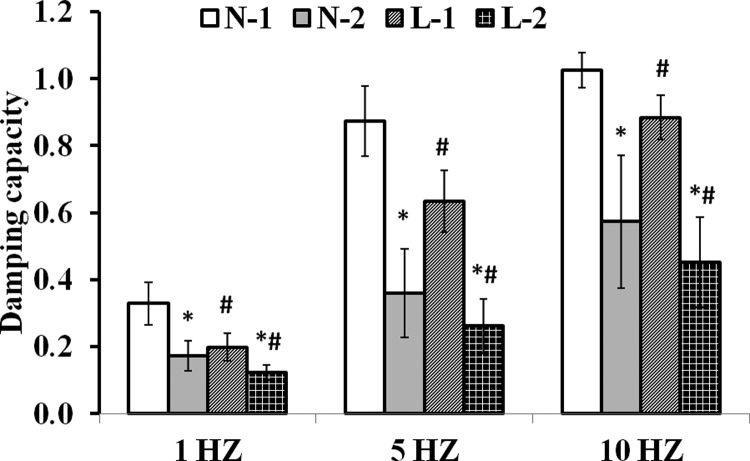
Fig. 5.
Damping capacity calculated from the nonlinear and linear methods with the P-LCSA at different frequencies (1, 5, and 10 Hz). In the legend, N denotes the nonlinear method; L denotes the linear method; 1 denotes group 1; 2 denotes group 2. The symbol ‘*’ denotes P < 0.05 for group 1 versus group 2 for the same method (nonlinear or linear); the ‘#’ symbol denotes P < 0.05 for the linear versus nonlinear method for the same group.

