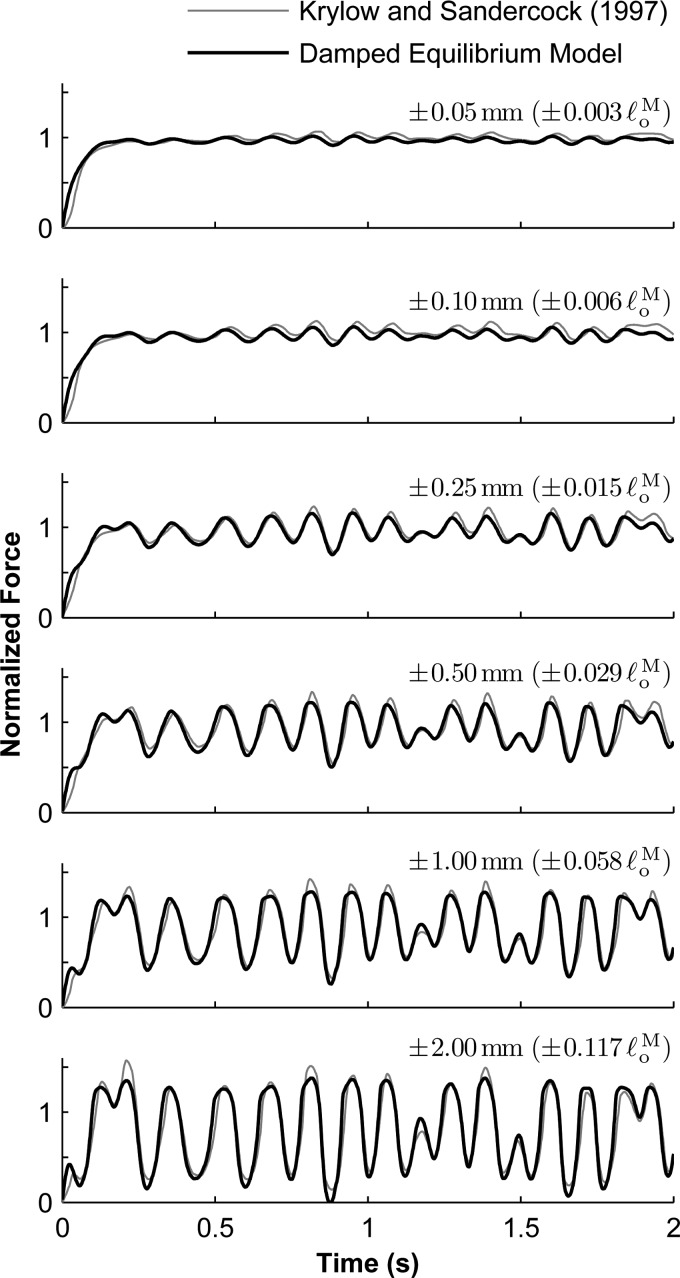
Fig. 10.
Comparison of experimental [29] (gray curve) and simulated (black curve) force profiles from maximally-activated muscle undergoing length changes of maximum amplitude (top), , , , , and (bottom). The maximum isometric force used in the model was and the optimal fiber length was .

