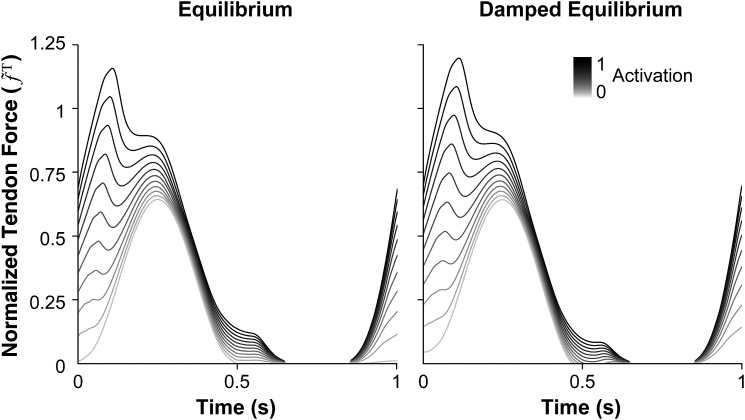
Fig. 5.
Normalized tendon force profiles of the equilibrium (left) and damped equilibrium (right) musculotendon models. Each muscle underwent constant-activation, sinusoidal-displacement simulations of 1-s duration with activations varying from 0 (0.01 for the equilibrium model) to 1 in increments of 0.1. The average absolute difference between normalized force profiles generated by the models was less than 0.3% at low activation and less than 2.5% at high activation.

