
Figure 2.
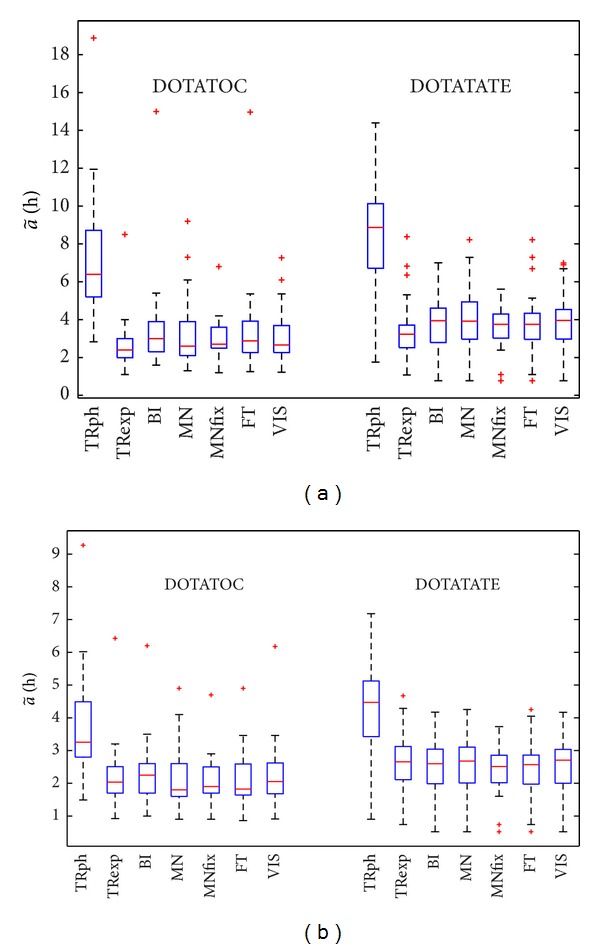
177Lu (a) and 90Y (b) time-integrated activities in hours for methods TRph, TRexp, BI, MN, MNfix, VIS, FT. Boxes draw the 25th percentile (lower box bound, indicating 25th of data fall below it), 50th percentile (i.e., median value), and 75th percentile (upper box bound). Crosses indicate outliers defined as observations out of 1.5 · (75th percentile value −25th percentile value). Whiskers extend to the most extreme values that are not outliers.