
Figure 4.
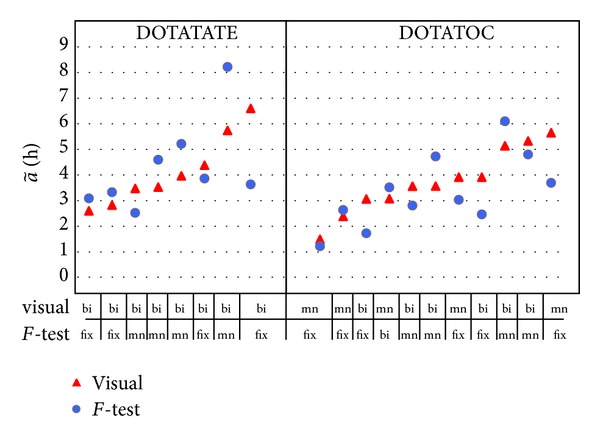
177Lu and for the cases in which there was a discrepancy greater than 10% between the visual and the F-test (8 cases for TATE, 11 for TOC).
Official websites use .gov
A
.gov website belongs to an official
government organization in the United States.
Secure .gov websites use HTTPS
A lock (
) or https:// means you've safely
connected to the .gov website. Share sensitive
information only on official, secure websites.
177Lu and for the cases in which there was a discrepancy greater than 10% between the visual and the F-test (8 cases for TATE, 11 for TOC).