
Figure 7.
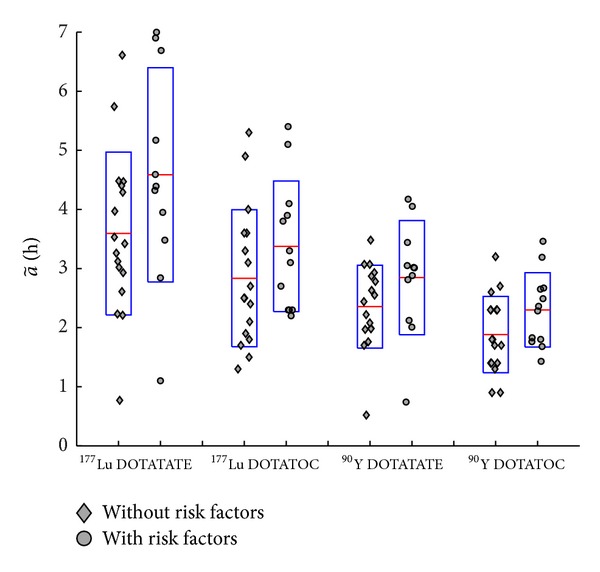
Time-integrated activity per unit activity for patients with risk factors (RF) (diamonds) and without (NRF) (dots). For each population, the mean value is indicated by the horizontal line, and the box extends to mean ± SD. For DOTATATE, 11 patients were RF and 17 NRF, and the P-values of t-test were 0.05 and 0.06, for 177Lu and 90Y, respectively. For DOTATOC, 12 patients were RF and 17 NRF (one outlier was excluded), and P-values were 0.09 and 0.06, for 177Lu and 90Y, respectively.