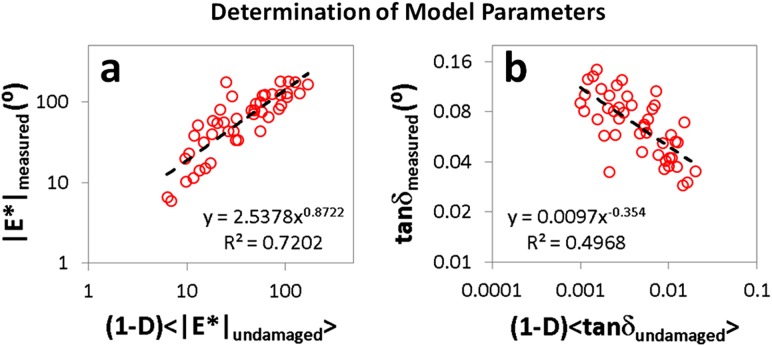
Fig. 4.
Measured values of (a) |E*| and (b) tanδ plotted against (1 –D) < |E*|damaged > and (1 – D) < tanδdamaged > for mouse patellar tendons three weeks after injury at P120 tested at 4, 6, and 8% strain with f = 1 Hz. The dashed black lines represent power law fits of the acquired data. Relationships derived from these fits were used to predict |E*| and tanδ in other damage groups.

