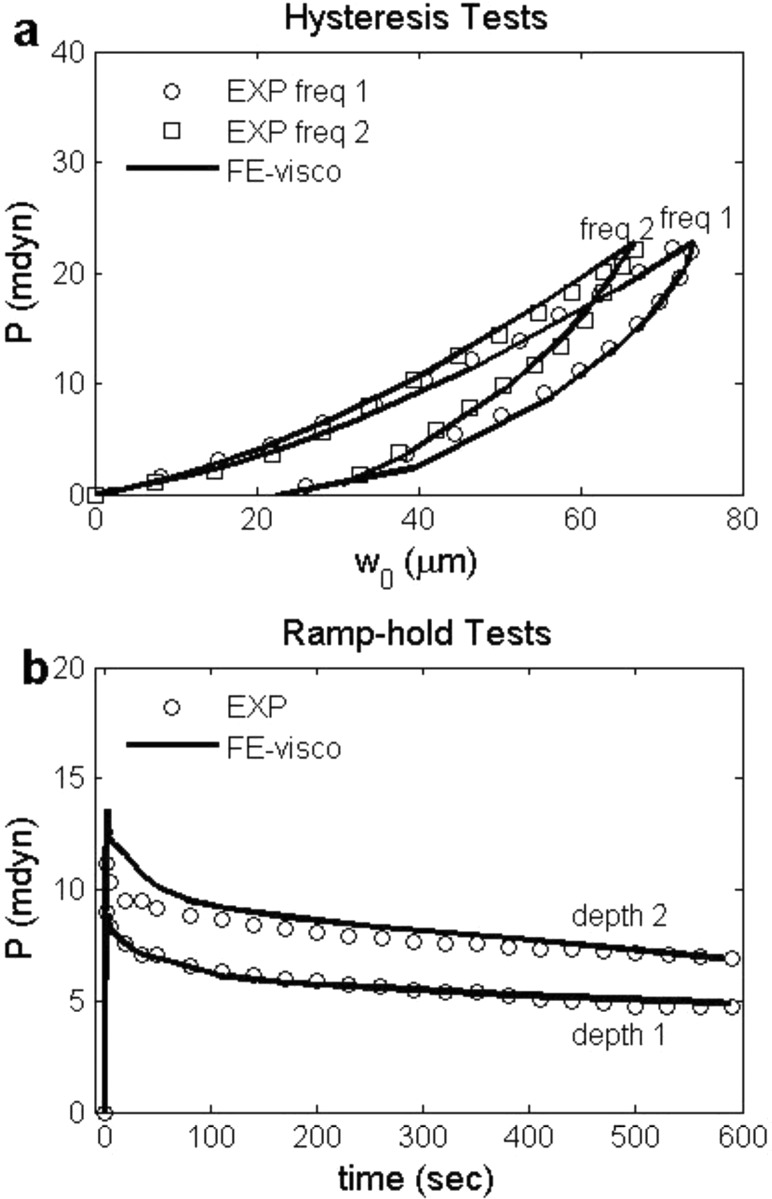
Fig. 4.
(a) Force-displacement curves of hysteresis tests with two representative loading/unloading rates for one representative intact heart (No. 1 in Table 2). (b) Force-time curves of ramp-hold tests with two indentation depths for another representative intact heart (No. 11 in Table 2). Best-fit viscoelastic finite element solutions (solid lines) using Ogden strain energy density function are shown together with experimental data (circles and squares).

