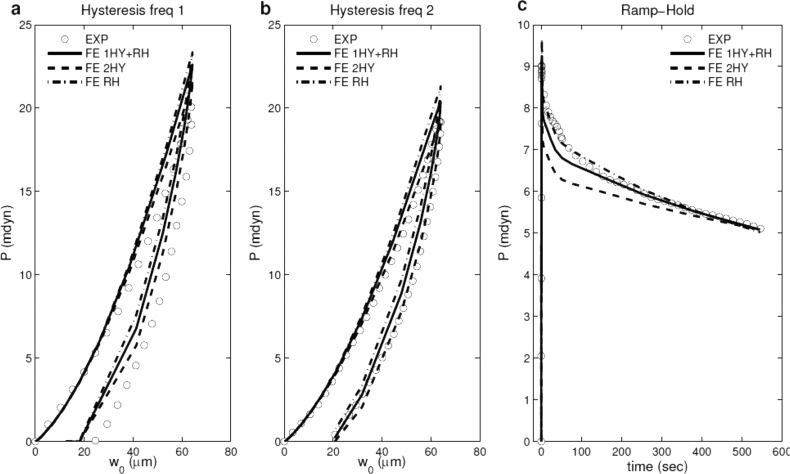
Fig. 6.
Force-displacement curves of hysteresis tests with (a and b) two representative loading/unloading rates and (c) force-time curve of ramp-hold test for the MY average experimental data (dotted lines). The solid lines represent the best-fit curves when the objective is to fit one hysteresis rate and ramp-hold curve only; the dash lines represent the best-fit curves when the object is to fit two hysteresis curves only; the dashed-dotted lines represent the best-fit curves when the object is to fit ramp-hold curve only.

