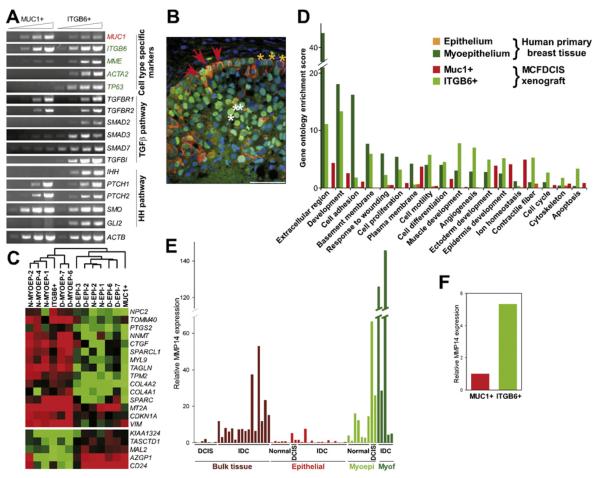
Figure 2. Similarity of the MCFDCIS Model to Human DCIS.
(A) Semiquantitative RT-PCR analysis of the expression of the indicated genes in MUC1+ and ITGB6+ cells purified from DCIS xenografts.
(B) Immunofluorescence analysis of CK5 (orange) and p53 (green) expression in human DCIS. Red arrows mark double-positive abnormal myoepithelial cells in the basal layer, whereas yellow and white arrows mark CK5+ normal myoepithelial and p53+ tumor epithelial cells, respectively. Scale bar corresponds to 50 μm.
(C) Dendogram depicting cluster analysis of SAGE libraries to delineate similarities of MUC1+ and ITGB6+ cells to human breast epithelial and myoepithelial cells, respectively.
(D) Gene ontology categories enriched in ITGB6+ and MUC1+ cells from MCFDCIS xenografts and epithelial and myoepithelial cells from primary human breast tissue. Scores > 1.3 correspond to p < 0.05.
(E) qPCR analysis of MMP14 in bulk DCIS and invasive ductal carcinoma (IDC) and in epithelial and myoepithelial cells, and myofibroblasts from normal human breast tissue, in situ carcinomas, and invasive carcinomas.
(F) qPCR analysis of MMP14 in MUC1+ and ITGB6+ cells.

