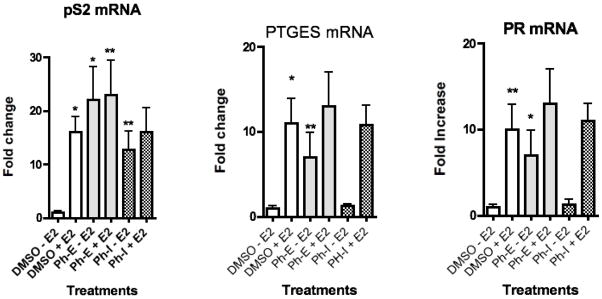
Fig. 4–6.

Results of RT-PCR analysis of endogenous estrogen responsive genes in MCF-7 breast cancer cells after treatment with the P. hispidium ethanol extract (Ph-E) or aqueous infusion (Ph-I) at a concentration of 20 μg/ml. Data is represented as fold increase in mRNA above control for (Figure 4) pS2, (Figure 5) PR, (Figure 6) PTGES. Data represent the mean SD of three separate experiments performed in triplicate. *p<0.05 and **p<0.01 versus control. Data is represented as fold increase in mRNA above control.
