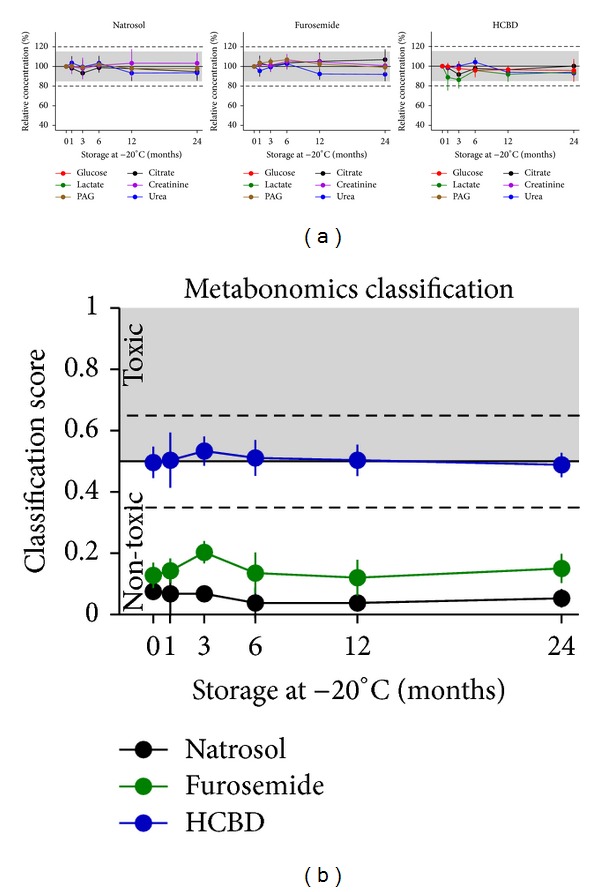
Figure 6.

Effects of storage at −20°C. Glucose, citrate, lactate, creatinine, PAG, and urea were measured in urine samples from natrosol-, furosemide-, or HCBD-treated rats by 1H NMR metabolite quantification. Samples were stored at –20°C over a period of up to 24 months; for each time-point a separate aliquot was used (mean ± SD for n = 7 per treatment group, including a selected set of samples with modified pH or salt concentration, for sample definition see Section 2.4). Samples were thawed by a standardized procedure shortly before measurement. (a) Single metabolite quantification results are given as relative concentrations normalized to the first measurement of the respective modified sample. Values close to or below LLOQ (i.e., glucose and lactate concentrations in the samples from natrosol- and furosemide-treated rats) excluded from evaluation. The grey range (15%) and dotted horizontal lines (20%) show the range of variation stated as acceptable by the “Guidance for Industry” [12]. (b) Prediction of nephrotoxicity was performed using a metabonomics approach (ensemble classification system). For each sample a classifier value is given, labelling the given compound as “(non-)toxic”. The horizontal line at 0.5 is the limit for the prediction of nephrotoxicity, the dashed lines at 0.35 and 0.65 represent an “intermediate” range, related to the statistical significance of the prediction.
