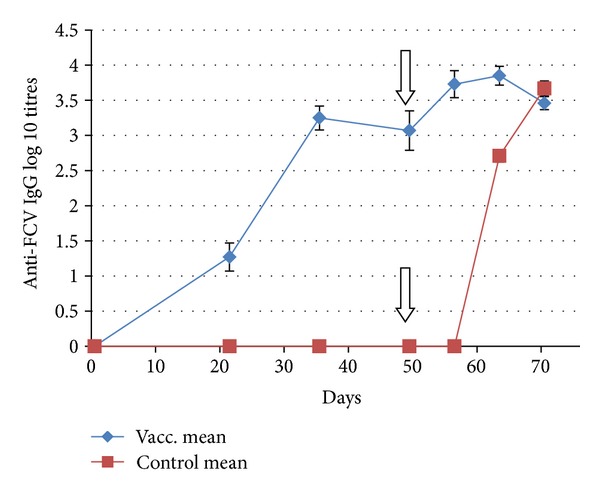
Figure 2.

Time courses of anti-FCV-F9-IgG responses in cats after vaccination with FCV-F9 (group mean, n = 10). Error bars denote the SEM. Vertical arrow indicates the day (d49 or pct0) when the cats were challenged with virulent heterologous FCV-255.
