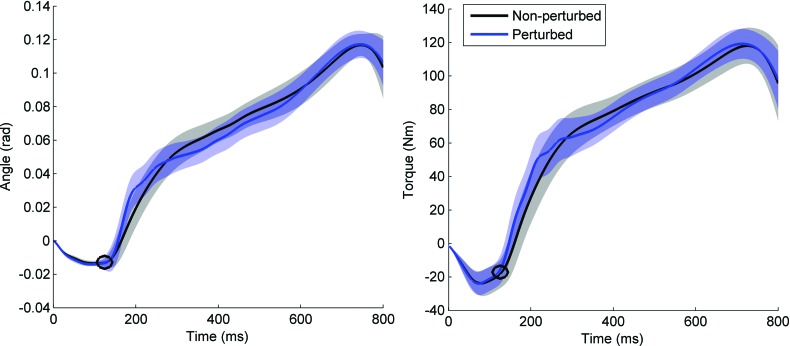
Fig. 5.
Prosthetic ankle angle (a) and ankle torque (b) shown during stance phase, beginning with heel contact. The nonperturbed trials are shown in black and the perturbed trials are shown in blue with the average shown in bold and the standard deviation in translucent. The circle denotes the onset of the perturbation.

