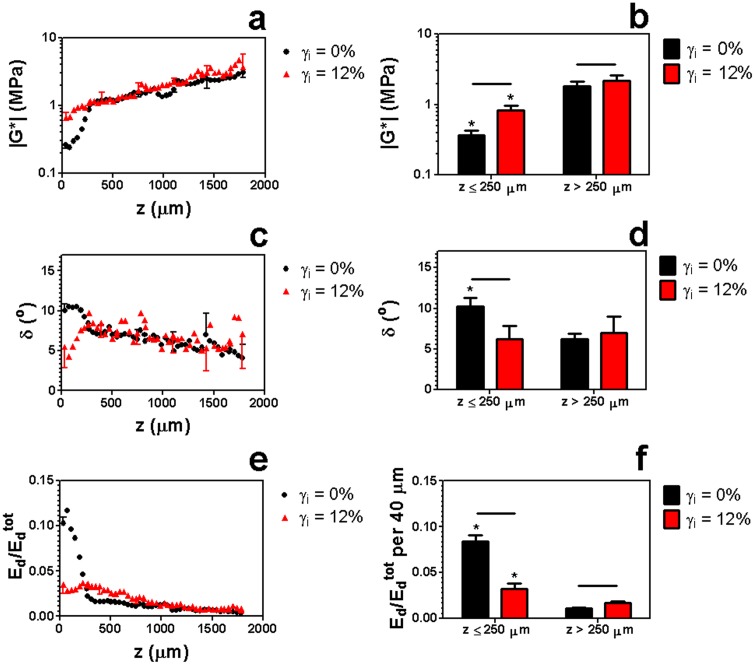
Fig. 7.
[(a) and (b)] vs. depth z in articular cartilage sheared from initial strains γi = 0% and γi = 12% with f = 1 Hz and εc = 20%. Data are mean ± SD, horizontal bars denote p ≤ 0.05/3, and (*) denotes p ≤ 0.05 versus (*) z > 250 μm. In (a), (c), and (e), only upper or lower error bars for selected points are shown to enhance clarity.

