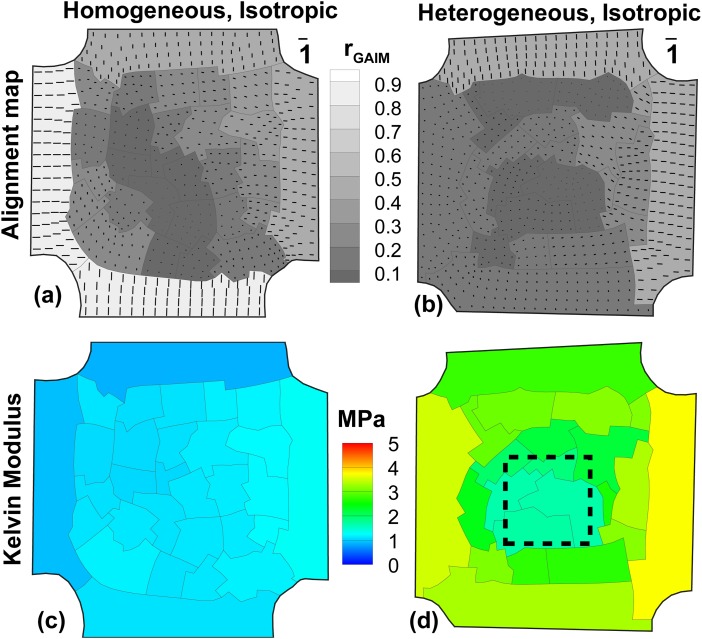
Fig. 3.
GAIM alignment maps (a,b) and Kelvin moduli plots (c,d) for isotropic PDMS samples. The length of vectors in (a,b) is the relative anisotropy in each partition. (a) Homogeneous sample shows low anisotropy values at the belly, indicating a largely isotropic sample. (b) Heterogeneous sample also shows low anisotropy, indicating an isotropic sample. (c) Homogeneous sample has uniform values in Kelvin modulus at the belly. (d) Heterogeneous sample shows a relatively compliant region at the center which corresponds to the location of the thin section (shown in dashed lines).

