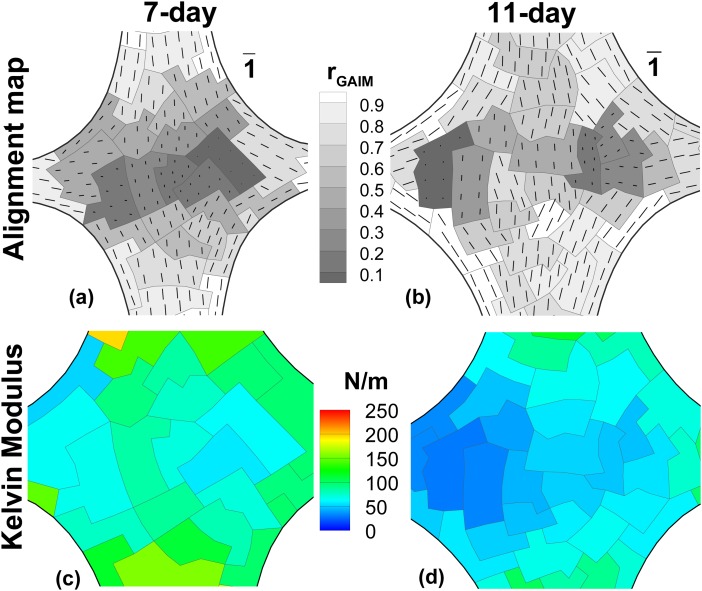
Fig. 5.
GAIM alignment maps and Kelvin modulus plots for 7-day and 11-day TE samples. The alignment maps from GAIM are indicative of the mechanical anisotropy of all elements in each partition. Alignment map for 7-day (a) and 11-day (b) samples show similar patterns to polarized light data, namely a large isotropic region for the 7-day, and increased alignment at 11-days. (c) Kelvin modulus (surface tension) plot for 7-day sample shows a range of values from 50-160 N/m at the belly. (d) Kelvin modului (surface tension) for 11-day sample are evaluated to be within 30-85 N/m at the belly.

