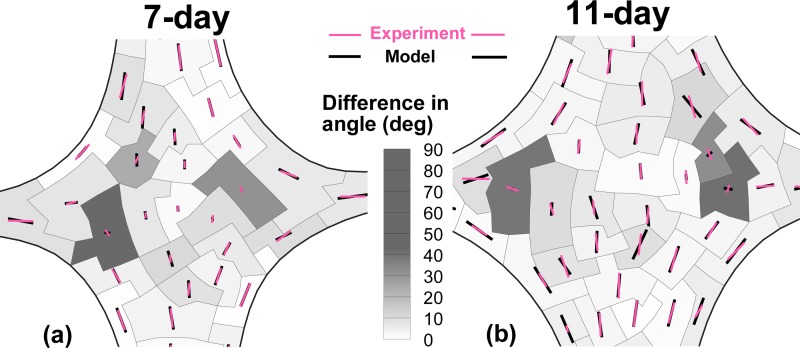
Fig. 6.
Comparison of alignment maps generated by the model (GAIM) and the experiment (polarized light microscopy) for 7-day and 11-day TE samples. The retardation and fiber alignment data from PLM were vector-averaged over each partition. The contour in the figures show the magnitude of difference in alignment angles between GAIM and PLM. The vectors indicate the relative anisotropy with the length given by the value of (for model) and averaged retardation (for experiment) in each partition. The length of the vectors in the legend indicate the maximum anisotropy of 1. There is excellent match between the alignments from model and experiments. The regions with large differences in angles correspond to largely-isotropic partitions where any angle is acceptable since there is no preferred direction.

