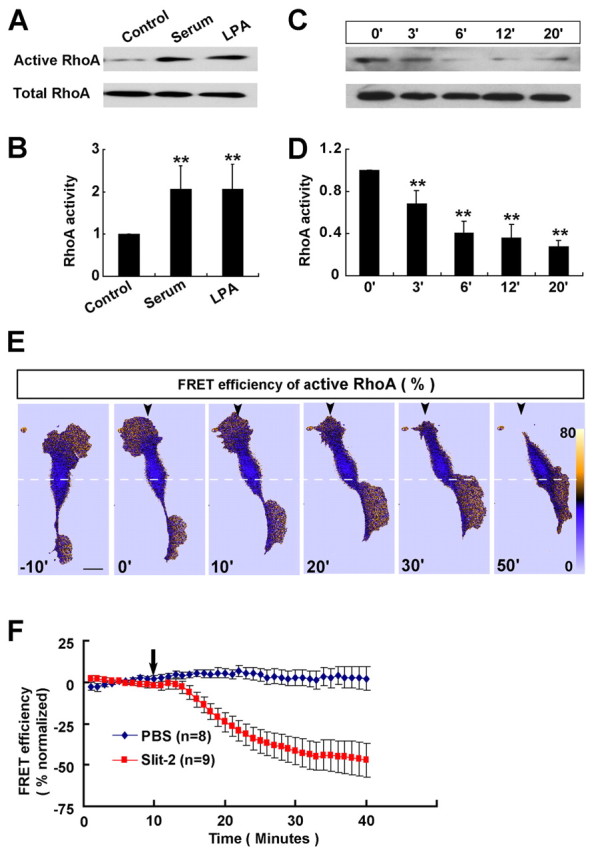
Fig. 7.

RhoA inhibition by Slit-2 is required for reversal of migration. (A–D) Representative western blots (A,C) and quantitative results (B,D) showing RhoA activity in response to treatment with serum (10%, 30 minutes), LPA (10 μM, 30 minutes) and Slit-2 (4 μg/ml, 0–20 minutes) in a pull-down assay. For quantitative analysis, the ratio of active RhoA to total RhoA was normalized to the baseline level (untreated control or 0 minutes). Data are mean + s.e.m.; **P<0.01, Student's t-test. (E) Representative FRET images (in pseudocolors) showing the inhibition and redistribution of active RhoA in response to a Slit-2 gradient. Scale bar: 20 μm. (F) Changes in the FRET signal at leading process of cultured OECs before and after the application of PBS or Slit-2 gradients.
